CHAPTER IV: RESULTS
IV.1 STUDY FLOW PROFILE
In this study, 181 potential participants were identified
during consultations. Of the 6 patients not included 3 did not have time to
participate in the study and 3 gave incomplete information. 175 patients were
finally retained for the study as they complied with the stated inclusion
criteria.
Figure 8 below illustrates a flow diagram of the recruitment
process.
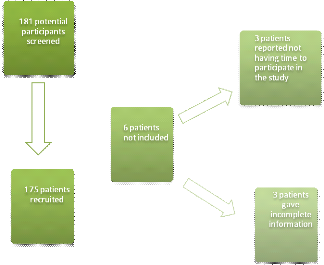
Figure 8: Participant flow
chart
I- SOCIODEMOGRAPHIC AND SOCIOECONOMIC CHARACTERISTICS OF
THE STUDY POPULATION
Table VIII shows the sociodemographic characteristics of study
participants.
Of the 175 patients recruited into the study, 54.90% were men
and 45.10% were women with a sex ratio of 1.2.
The mean age of the study participants was 60.1 #177; 11.1
years with extremes from 33 to 88 years and with the age group =60 years being
the most represented (48%; n =48).
The majority of the participants lived in an urban setting
(88.60%), while 11.40% of them lived in rural communities.
Among the 175 participants, 51.43% had a non-liberal
profession and 21.14% were unemployed. The non-liberal class was represented in
majority by public servants.
Of the 175 participants, 66.30% of participants lived as a
couple either legally married or not while 33.7% were single (either divorced,
never married or widowed).
Most participants in our study (40%) had a higher education.
2.3% never went to a formal system of education.
Among the 175 participants, 84.60% spent less than 1 hour to
reach the YGH. The mean trip duration was 38.6 #177; 30.8 minutes with extremes
between 5 minutes and 3 hours.
Three sociodemographic factors were found to be significantly
associated with poor therapeutic adherence: single marital status (OR = 4.66;
CI95 =2.07 - 11.28 ; p <0.001); 1st cycle
secondary education (OR = 3.03; CI95 =1.22 - 8.42 ; p
<0.001); and more than 1 hour trip duration (OR = 7.39; CI95
=1.93 - 47.51; p <0.001).
Urban place of residence (OR = 0; CI95 =0 -
0.29 ; p <0.001); living as a couple (OR = 0.21; CI95 =
0.09 - 0.48 ; p <0.001) and <1 hour trip duration (OR = 0.14;
CI95 =0.02 - 0.52; p <0.001) were significantly associated with
good adherence.
Table VIII: Sociodemographic
characteristics of the study population
|
Poor adherence
|
Good adherence
|
Total
|
P-value*
|
PA**
|
|
Sociodemographic variables
|
n (%)
|
n (%)
|
n (%)
|
|
|
|
Gender
|
|
|
|
|
|
|
Male
|
66 (68.8)
|
30 (31.3)
|
96 (54.9)
|
0.400
|
|
|
Female
|
52 (65.8)
|
27 (34.2)
|
79 (45.1)
|
0.400
|
|
|
Age (years)
|
|
|
|
|
|
|
<40
|
4 (80)
|
1 (20)
|
5 (2.9)
|
0.470
|
|
|
[40-50[
|
18 (75)
|
6 (25)
|
24 (13.7)
|
0.270
|
|
|
[50-60[
|
43 (70.5)
|
18 (29.5)
|
61 (34.9)
|
0.320
|
|
|
=60
|
53 (62.4)
|
32 (37.6)
|
85 (48.6)
|
0.110
|
|
|
Place of residence
|
|
|
|
|
|
|
Urban
|
98 (63.2)
|
57 (36.8)
|
155 (88.6)
|
<0.001
|
|
|
Rural
|
20 (100)
|
0 (0)
|
20 (11.4)
|
0.000
|
|
|
Profession
|
|
|
|
|
|
|
Liberal
|
28 (58.3)
|
20 (41.7)
|
48 (27.4)
|
0.080
|
|
|
Non-Liberal
|
61 (67.8)
|
29 (32.2)
|
90 (51.4)
|
0.520
|
|
|
Unemployed
|
29 (78.4)
|
8 (21.6)
|
37 (21.1)
|
0.080
|
|
|
Marital status
|
|
|
|
|
|
|
Single
|
51 (86.4)
|
8 (13.6)
|
59 (33.7)
|
<0.001
|
0.0003
|
|
Couple
|
67 (57.8)
|
49 (42.2)
|
116 (66.3)
|
<0.001
|
|
|
Level of education
|
|
|
|
|
|
|
Never gone to school
|
3 (75)
|
1 (25)
|
4 (2.3)
|
0.610
|
|
|
Primary
|
19 (70.4)
|
8 (29.6)
|
27 (15.4)
|
0.460
|
|
|
Secondary-1st cycle
|
31 (83.8)
|
6 (16.2)
|
37 (21.1)
|
0.010
|
0.0209
|
|
Secondary-2nd cycle
|
22 (59.5)
|
15 (40.5)
|
37 (21.1)
|
0.170
|
|
|
Higher education
|
43 (61.4)
|
27 (38.6)
|
70 (40)
|
0.110
|
|
|
Trip duration (hour)
|
|
|
|
|
|
|
<1
|
93 (62.8)
|
55 (37.2)
|
148 (84.6)
|
<0.001
|
|
|
=1
|
25 (92.6)
|
2 (7.4)
|
27 (15.4)
|
<0.001
|
0.008
|
*p-value from Chi-square test; **PA is p-value
adjusted for significant factors obtained from logistic regression analysis
using variables with P < 0.05 in bivariate analysis as candidate
variables.
Figure 9 shows the distribution of participants according to
socioeconomic status. The high socioeconomic status group was greatly
represented (60%) in our study followed middle socioeconomic status group
(39.40%).Middle socioeconomic status was found to be significantly associated
to poor therapeutic adherence (OR = 2.68; CI95 = 1.33-5.53; p <
0.001).
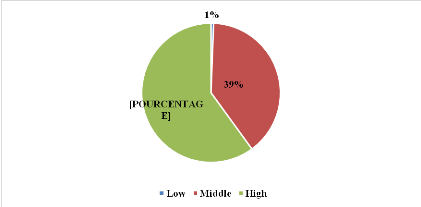
Figure 9: Distribution
according to socioeconomic status
Figure 10 shows the distribution of participants according to
possession of health insurance. Only 11.00% of our study population had a
health insurance.
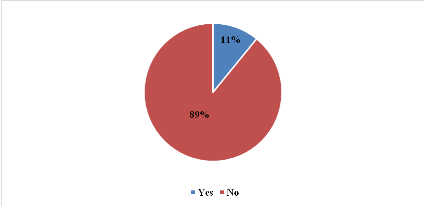
Figure 10:Distribution
according to possession of health insurance
II- CLINICAL AND THERAPEUTIC CHARACTERISTICS OF THE STUDY
POPULATION
Figure 11 shows the BP distribution of the study participants.
The High Normal BP group was the most represented (n=43; 24.60%). Only 4.60%
had a Grade III hypertension.
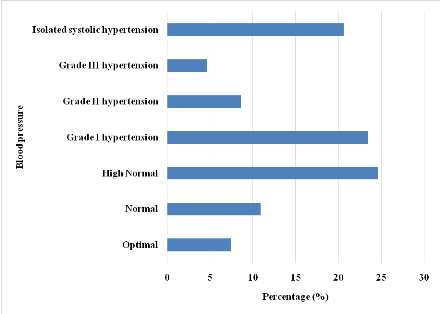
Figure 11: Blood pressure
distribution of the study population on enrolment
Figure 12 shows the distribution of participants according to
BP status. 57.70% of the study population had a controlled BP and 42.30% were
uncontrolled.
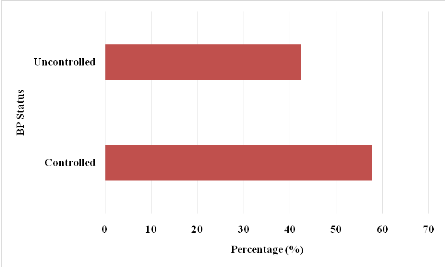
Figure 12: Blood pressure
status distribution of the study population
Figure 13 illustrates the distribution of comorbidities of the
study population. The most frequently associated pathology to HBP was heart
failure (24.57%) followed by hypercholesterolemia (20.00%).
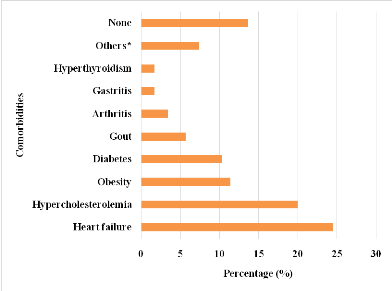
*Other comorbidities encountered in the study included :
gout, arthritis, gastritis, hyperthyroidism, epilepsy, anemia, asthma, benign
prostate hypertrophy, depression, glaucoma, haemorrhoids, and deep venous
thrombosis
Figure 13: Distribution of
comorbidities of the study population
Figure 14 shows the distribution of participants according to
type of handicap.32 participants had a form of handicap. 16.57% of the study
population had a motor handicap and 1.71% had a sensory handicap. Presence of
handicap was found to be significantly associated to poor therapeutic adherence
(OR = 4.12; CI95 = 1.45-14.34; p < 0.001).
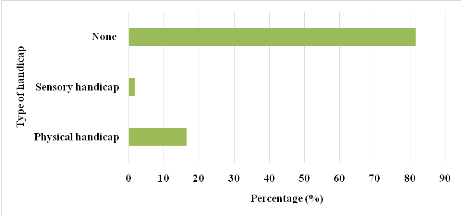
Figure 14: Distribution
according to type of handicap
Table IX shows the different classes screened in the study.
Calcium channel blockers was the most encountered (31.90%) monotherapy drug
class in our study. ACE inhibitors/thiazide diuretics was the most encountered
fixed-dose combination bitherapy (40.96%). ACE inhibitors/Thiazide
diuretics/CCBs was the most frequent fixed-dose combination tritherapy
encountered (81.80%).
Table IX: Distribution
according to class of antihypertensive used by the study population on
enrolment
|
Fixed-dose therapies
|
Number
|
Percentage (%)
|
|
Monotherapy
|
|
|
|
CCBs*
|
69
|
31.90
|
|
BBs**
|
40
|
18.50
|
|
Loop diuretics
|
39
|
18.10
|
|
ACE*** inhibitors
|
29
|
13.40
|
|
Thiazide diuretics
|
18
|
8.30
|
|
Potassium-sparing diuretics
|
11
|
5.10
|
|
ARA2****
|
7
|
3.20
|
|
Centrally acting antihypertensives
|
3
|
1.40
|
|
Total
|
216
|
100.00
|
|
Bitherapy
|
|
|
|
ACE inhibitors/Thiazide diuretics
|
34
|
40.96
|
|
ACE inhibitors/CCBs
|
18
|
21.69
|
|
ARA2/Thiazide diuretics
|
8
|
9.64
|
|
Thiazide diuretics/CCBs
|
7
|
8.43
|
|
BB/Thiazide diuretics
|
5
|
6.02
|
|
Potassium-sparing diuretics/Thiazide diuretics
|
5
|
6.02
|
|
CCBs/ARA2
|
4
|
4.82
|
|
BB/Thiazide diuretics
|
1
|
1.20
|
|
Thiazide diuretics/Rauwolfia alkaloid
|
1
|
1.20
|
|
Total
|
83
|
100.00
|
|
Tritherapy
|
|
|
|
ACE inhibitors/Thiazide diuretics/CCBs
|
9
|
81.80
|
|
CCBs/ARA2/Thiazide diuretics
|
2
|
18.20
|
|
Total
|
11
|
100.00
|
***ACE: Angiotensin Converting Enzyme; ****ARA2: Angiotensin 2
Receptor Antagonist; **BB: Beta Blocker; *CCB: Calcium Channel Blocker
Table X portrays the therapeutic characteristics of the study
population.
In this study, 81.10% of participants had less than 3
different antihypertensives at the moment of enrolment.
Of the 175 participants, 46.30% had a monthly medication cost
between 10000FCFA and 20000FCFA followed by 33.10% whose monthly drug cost was
<10000FCFA. Only 5.10% had a monthly drug cost of =30000FCFA. The mean
monthly drug cost was 14543 #177; 8613 FCFA with extremes between 800FCFA and
50000FCFA.
Among the 175 participants, 98.30% were on a once daily
medication schedule and 92.60% took their medication(s) in the morning with
breakfast. In this study, 65.70% were on monotherapy and 88.60% were on a
specialty drug. Of the 175 participants, 38.30% experienced side effects with
respect to ongoing treatment.
Among the 175 participants, 55.40% were on treatment for less
than 10 years. Mean duration on treatment was 9.4 #177; 7.3 years with extremes
from 7 months to 36 years.
3 therapeutic variables were found to be significantly
associated with poor adherence; monotherapy (OR = 2.07; CI95 =1.07
- 4; p = 0.020); drug taking in the evening (OR = 2.55; CI95
=1.07-6.62; p = 0.030); presence of side effects (OR = 11.51; CI95
=4.47-34.2; p = 0.000).
<10000FCFA monthly treatment cost was found to be
significantly associated with good therapeutic adherence(OR = 0.5; CI95
=0.26-0.97; p = 0.030).
Table X: Distribution of
therapeutic variables
|
Poor adherence
|
Good adherence
|
Total
|
P-value*
|
PA**
|
|
Therapeutic variables
|
n (%)
|
n (%)
|
n (%)
|
|
|
|
Antihypertensive taken
|
|
|
|
|
<3
|
92 (64.8)
|
50 (35.2)
|
142 (81.1)
|
0.090
|
|
|
=3
|
26 (78.8)
|
7 (21.2)
|
33 (18.9)
|
0.090
|
|
|
Therapy type
|
|
|
|
|
|
|
Monotherapy
|
84 (73)
|
31 (27)
|
115 (65.7)
|
0.020
|
0.0295
|
|
Bitherapy
|
55 (66.3)
|
28 (33.7)
|
83 (47.4)
|
0.440
|
|
|
Tritherapy
|
5 (45.5)
|
6 (54.5)
|
11 (6.3)
|
0.100
|
|
|
Posology
|
|
|
|
|
|
|
Once daily
|
116 (67.4)
|
56 (32.6)
|
172 (98.3)
|
0.700
|
|
|
Twice daily
|
22 (78.6)
|
6 (21.4)
|
28 (16)
|
0.120
|
|
|
Thrice daily
|
1 (100)
|
0 (0)
|
1 (0.6)
|
0.670
|
|
|
Moment the drug was taken
|
|
|
|
|
|
|
Morning
|
109 (67.3)
|
53 (32.7)
|
162 (92.6)
|
0.580
|
|
|
Afternoon
|
6 (60)
|
4 (40)
|
10 (5.7)
|
0.420
|
|
|
Evening
|
31 (81.6)
|
7 (18.4)
|
38 (21.7)
|
0.030
|
0.0399
|
|
Morning, evening
|
22 (81.5)
|
5 (18.5)
|
27 (15.4)
|
0.070
|
|
|
Morning, afternoon, evening
|
1 (100)
|
0 (0)
|
1 (0.6)
|
0.670
|
|
|
Side-effects
|
|
|
|
|
|
|
Yes
|
62 (92.5)
|
5 (7.5)
|
67 (38.3)
|
<0.001
|
<0.001
|
|
No
|
56 (51.9)
|
52 (48.1)
|
108 (61.7)
|
|
|
|
Type of medication taken
|
|
|
|
|
|
|
Specialty
|
106 (68.4)
|
49 (31.6)
|
155 (88.6)
|
0.300
|
|
|
Generic
|
44 (71)
|
18 (29)
|
62 (35.4)
|
0.290
|
|
|
Monthly drug cost (FCFA)
|
|
|
|
|
|
<10000
|
33 (56.9)
|
25 (43.1)
|
58 (33.1)
|
0.030
|
|
[10000-20000[
|
59 (72.8)
|
22 (27.2)
|
81 (46.3)
|
0.100
|
|
[20000-30000[
|
20 (74.1)
|
7 (25.9)
|
27 (15.4)
|
0.290
|
|
=30000
|
6 (66.7)
|
3 (33.3)
|
9 (5.1)
|
0.610
|
|
Duration on treatment (years)
|
|
|
|
|
|
<10
|
66 (68)
|
31 (32)
|
97 (55.4)
|
0.423
|
|
[10-20[
|
37 (71.2)
|
15 (28.8)
|
52 (29.7)
|
0.252
|
|
=20
|
15 (57.7)
|
11 (42.3)
|
26 (14.9)
|
0.132
|
|
*p-value from Chi-square test; **PA is p-value adjusted
for significant factors obtained from logistic regression analysis using
variables with P < 0.05 in bivariate analysis as candidate
variables.
|
III- ASSESSMENT OF ADHERENCE TO ANTIHYPERTENSIVE
TREATMENT
Of the 175 participants, 32.60% were high adherers; 40.60% of
participants were medium adherers; and 26.90% were low adherers. Table XIshows
the adherence profiles of the study population while figure 15 illustrates the
level of adherence.
Table XI: Distribution of
adherence profiles
|
Adherence profile (Morisky score)
|
Number
|
Percentage (%)
|
|
Low adherers
|
47
|
26.90
|
|
Medium adherers
|
71
|
40.60
|
|
High adherers
|
57
|
32.60
|
|
Total
|
175
|
100.00
|
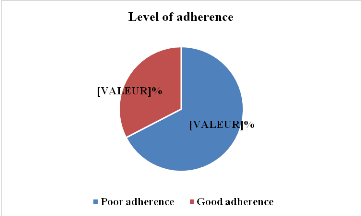
Figure 15: Distribution of
adherence levels
IV- ASSOCIATION OF ADHERENCE WITH BP STATUS
Table XII shows the distribution according to BP status and
good adherence. 36.57% of the study participants who had a poor adherence to
medication equally had an uncontrolled BP. Of the 74 participants having an
uncontrolled BP, 86.49% had poor therapeutic adherence.
Uncontrolled (OR = 5.57; CI95 =2.6-12.48; p =
0.000) BP was found to be significantly associated with poor therapeutic
adherence.
A controlled BP status (OR = 0.18; CI95 =0.08-0.38;
p = 0.000) was found to be significantly associated to good therapeutic
adherence.
Table XII: Distribution
according to blood pressure status and good adherence
|
BP status
|
Good adherence
|
|
Yes (%)
|
No (%)
|
Total (%)
|
|
Controlled
|
47 (26.86)
|
54 (30.86)
|
101 (57.71)
|
|
Uncontrolled
|
10 (5.71)
|
64 (36.57)
|
74 (42.29)
|
|
Total
|
57 (32.57)
|
118 (67.42)
|
175 (100)
|
V- LEVEL OF KNOWLEDGE OF STUDY POPULATION
Figure 16 shows the distribution according to level of
knowledge on hypertension. Of the 175 participants, 54.30% were knowledgeable
about hypertension and 37.7 % had good knowledge.
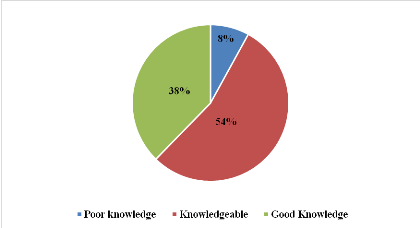
Figure 16: Distribution
according to level knowledge on hypertension
After multivariate analysis with logistic regression 9
predictive factors of poor therapeutic drug adherence were identified (Table
XIII): 1st cycle secondary education(p=0.0209; OR = 3.0287); Single
marital status (p = 0.0003; OR = 4.6623); trip duration of= 1 hour away from
the hospital (p = 0.008; OR = 7.3925); middle socioeconomic status (p = 0.006;
OR = 2.6814);uncontrolled BP status(p = 0; OR = 5.5704); presence of handicap(p
= 0.0117; OR = 4.1222); Monotherapy(p = 0.0295; OR = 2.0721); presence of side
effects(p = 0; OR = 11.5143);and taking medication in the evening (p = 0.0399;
OR = 2.5452).
Table XIII: Predictive factors of poor therapeutic
adherence
|
Variable
|
Odds Ratio
|
C.I. 95%
|
P-Value
|
|
Level of education: Secondary-1st cycle
|
3.0287
|
1.1831-7.7536
|
0.0209
|
|
Marital status: Single
|
4.6623
|
2.0302-10.7068
|
0.0003
|
|
Trip duration: = 1 hour
|
7.3925
|
1.6856-32.4209
|
0.008
|
|
Socioeconomic status: Middle
|
2.6814
|
1.3272-5.4172
|
0.006
|
|
BP status: Uncontrolled
|
5.5704
|
2.5723-12.0626
|
<0.001
|
|
Presence of handicap
|
4.1222
|
1.3706-12.3976
|
0.0117
|
|
Type of therapy: Monotherapy
|
2.0721
|
1.0752-3.9932
|
0.0295
|
|
Presence of side effects
|
11.5143
|
4.2945-30.8719
|
<0.001
|
|
Moment drug is taken: Evening
|
2.5452
|
1.0443-6.2033
|
0.0399
|
| 


