Troisième Partie :
![]()
CHAPITRE I. DES CARACTERISTIQUES GENERALES DES TSIC
1.1. Du répertoire des
Techniciens Supérieurs en Instrumentation Chirurgicale
formés depuis la création de la
filière jusqu'à nos jours
Dans la figure n°1, se trouvent par promotion les
pourcentages des TSIC formés depuis la création de la
filière jusqu'à nos jours.
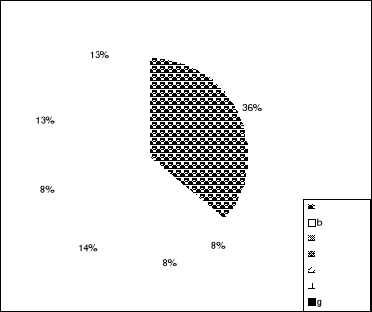
1ère Promotion (1999 - 2002)
2ème Promotion (2000 - 2003)
3ème Promotion (2001- 2004)
4ème Promotion (2002 - 2005)
5ème Promotion (2003 - 2006)
6ème Promotion (2004 - 2007)
7ème Promotion (2005 - 2008)
Figure 1 :
répartition des TSIC suivant les promotions
1.2. Catégorie socio-professionnelle des TSIC
formés suivant les promotions
Dans le tableau n°I figurent, par catégorie
socio-professionnelle, les TSIC formés depuis la création de la
filière à nos jours :
Tableau I : Répartition des TSIC suivant la
catégorie socio-professionnelle
|
P1
|
P2
|
P3
|
P4
|
P5
|
P6
|
P7
|
Total
|
%
|
|
Infirmiers
|
19
|
01
|
00
|
03
|
05
|
03
|
05
|
36
|
50
|
|
Sages-femmes
|
01
|
00
|
00
|
01
|
01
|
00
|
01
|
04
|
5,56
|
|
Bacheliers
|
06
|
08
|
09
|
02
|
04
|
03
|
00
|
32
|
44,44
|
|
TOTAL
|
26
|
09
|
09
|
06
|
10
|
06
|
06
|
72
|
100
|
1.3. Répartition des TSIC formés selon la
nationalité depuis la création de la filière
jusqu'à nos jours
Il y avait 67 TSIC Togolais formés soient 93% contre 5
Béninois soient 7%
1.4. Répartition des TSIC formés selon
l'occupation professionnelle actuelle Dans le tableau n°II,
figurent les TSIC formés selon l'occupation professionnelle
actuelle :
Tableau II : Répartition des TSIC
formés selon l'occupation actuelle
|
Nombre de TSIC
|
Pourcentage (%)
|
|
En fonction
|
47
|
70,15
|
|
Ne pratiquent plus
|
03
|
4,48
|
|
Non engagés
|
05
|
7,46
|
|
Retraités
|
11
|
16,41
|
|
Décédés
|
01
|
1,50
|
|
TOTAL
|
67
|
100
|
1.5. Répartition des TSIC formés selon
leurs lieux d'exercice professionnel
Dans le tableau n°III, figurent selon leurs lieux
d'exercice professionnel les TSIC formés depuis la création de la
filière jusqu'à nos jours :
Tableau III : Répartition des TSIC
formés selon les lieux d'exercice professionnel
|
Nombre de TSIC
|
Pourcentage (%)
|
|
- A Lomé :
· CHU-TOKOIN
· District sanitaire de Bê
· Cliniques privés
Total :
|
26
03
02
31
|
55,30
6,40
4,30
66
|
|
- A l'intérieur du TOGO :
· CHR ATAKPAME
· CHP BASSAR
· CHR DAPAONG
· CHU KARA
· CHR KARA
· CHR SOKODE
· CHP TCHAMBA
· CHP TSEVIE
|
03
01
02
03
03
02
01
01
|
6,38
2,12
4,25
6,38
6,38
4,25
2,12
2,12
|
|
Total :
|
16
|
34
|
| 

