4.1.2. Discharge Time
Series Analysis
Trend analysis of the downstream part of the Mono River basin
has been done also with 40 years of river discharge data from 1971 to 2010.
Statistical properties of the annual and monthly flow series were tested and
presented in "annexe 3". The results show positive skewness which means the
data were normally distributed. According to the results, all the individual
months show the largest CV representing similar variation during the study
period. The annual average discharge for these 40 years is 114.985
m3/s. During the record period,
the maximum discharge occurred in the year 2001 with the total
discharge of 262.408 m3/s approximately and a minimum discharge in
the year 1984 with the total of around 19.09 m3/s.
On running the Mann-Kendall test on river discharge data, the
Sen's slope shows an evidence of a positive trend in annual series. The rate of
annual rainfall change is about 2.462m3/s/year. The result indicates
that the null hypothesis was rejected for the annual discharge trend (p-value=
0.002) "annexe 4". Thus, statistically significant positive trend is found for
annual river discharge over the time period.
On plotting the linear trend line for the 40 years river
discharge data, the following results in "Figure 9 " were obtained.
Annual discharge plot
Discharge
Linear fit
Y= 2.625x + 61.173
R2 = 0.2706
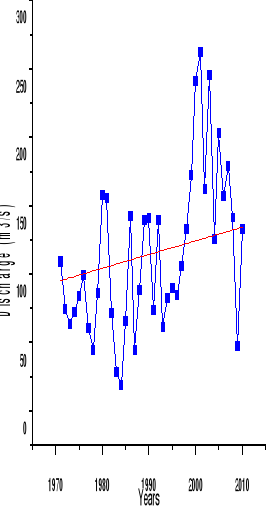
Figure 9: Average annual
discharge variation (1971-2010)
The "figure 10" shows the monthly discharge distribution of 40
years. It shows one peak in September (333.442 m3/s)
Monthly Average Discharge
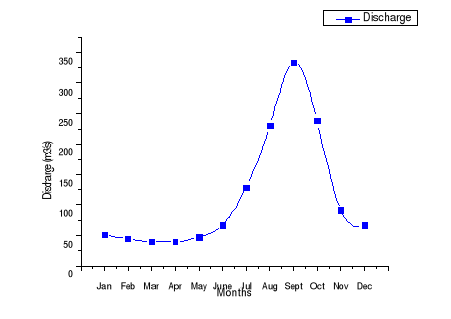
Figure
10: Monthly discharge Average(1971-2010)
In the non-parametric Mann-Kendall test, monthly
trends of river flow for 40 years have been calculated for each month
individually together with the Sen's magnitude of slope (Q). The Sen's
slope reveals the trend of the series for 40 years for individual 12 months
from January to December which are 2.653, 2.13, 2.233, 2.031, 2.289, 0.910,
-1.354, -3.391, -4.697, -0.047, 2.295, and 3.433 respectively. While
July, August, September and October show an evidence of negative trend, the
others months show evidence of positive trend. The Null hypothesis was accepted
for July, August and October months and rejected for the others months "annexe
4".
Annual Discharge Cumulative Deviation
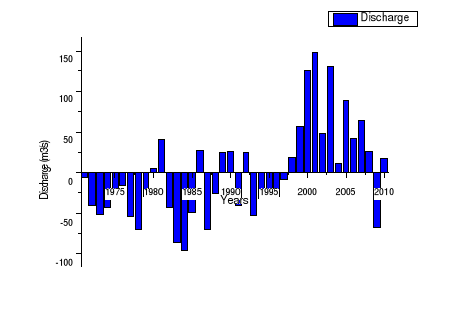
Figure 11: Annual discharge
cumulative deviation (1971-2010)
The "figure 11" shows the cumulative deviation from mean that
reveals a cyclic pattern of variations with alternating low and high discharge
years. Three main phases of different lengths were detected (1971-1978,
1979-1997 and 1998-2010). The first phase shows negative anomalies that let to
conclude a low discharge phase. It is followed by a period (1979-1997)
characterized by variations with alternating low and high discharge years. The
last period (1998-2010) shows a phase of high discharge years. This result
explains river discharge variability over the study area during the period of
record.
The application of the trend analysis reveals an overall upward
trend in annual rainfall and river discharge. It is well known that rainfall is
one of the major inputs into runoff processes while river discharge shows a
composite response of the whole basin. The upward trend in the two variables
may show a causal effect of rainfall on river discharge and an evidence of
climate variability. The evidence of positive trend in the river discharge and
the rainfall characteristics suggest that the study area may be exposed to
either river flood or flash flood.
The result equally shows that even though there is an evidence
of upward trend in annual rainfall and river discharge in the study area , the
trend in the rainfall series is not significant compared to the one of the
river discharge. This may be explained by these studies (Rossi 1996, Klassou
1996, Amoussou and al.2012, ) which show that the Mono River is under the
influence of downstream and upstream rainfall and besides, under the effect of
the Nangbéto dam put in service since 1988 for hydropower production
reasons which confers to the river an artificial character at the downstream
part. According to the interview carried out in the scope of this study, the
increase of flood hazards in the area is not only due to change in
precipitation patterns causing overflow of the river but also to man-made
actions such as: the regular opening of Nangbeto dam at the upstream of the
basin. Clearly, flood hazard in the study area is a natural phenomenon which
was exacerbated by anthropogenic factors.
From the result, river flood peaks may occur in September. The
increase of river discharge causing flood hazards in the study area calls up
the need to describe past floods magnitudes in order to predict design floods
for the targeted area. To this end, calculation of the return period as well as
the probability of occurrence of past flood magnitude to estimate the likely
values of discharges to expect in the river at various recurrence intervals
based on the available historical record was carried out.
| 

