4.2. Availability of goods
and services due to SUT improvement
Obviously, as the SUT improves and that the GDP increases,
Rwandans are likely to possess more and better goods and services (after all
that is the SUT model to economic development measures). On average, like the
GDP of Rwanda is increasing, Rwandans tend to enjoy larger, better constructed,
and more comfortable homes, higher quality food and clothing, a greater variety
of entertainment and cultural opportunities, better access to transportation
and travel, better communications and sanitation, and other advantages.
Through 10 years ago, Rwandans have made tremendous sacrifices
and taken great risks to secure a high standard of living themselves and their
families. In fact this initiative is viewed in SUT structure year by year and
improvement of satellite accounts data which have ameliorated Rwanda's economic
development indicators such as HDI, Life expectancy, people living in good
hygienic conditions.
|
GROSS DOMESTIC PRODUCT BY KIND OF ACTIVITY CURRENT
PRICES (in Billion Frw)
|
|
YEARS
|
GDP
|
Agriculture
|
Industry
|
Services
|
Adjustments
|
|
1999
|
607
|
227
|
88
|
257
|
34
|
|
2000
|
676
|
251
|
92
|
298
|
35
|
|
2001
|
742
|
277
|
105
|
317
|
42
|
|
2002
|
797
|
282
|
11
|
352
|
53
|
|
2003
|
993
|
380
|
127
|
421
|
65
|
|
2004
|
1206
|
465
|
167
|
497
|
77
|
|
2005
|
1440
|
553
|
202
|
596
|
89
|
|
2006
|
1716
|
660
|
236
|
720
|
100
|
|
2007
|
2046
|
729
|
285
|
912
|
119
|
|
2008
|
2579
|
834
|
382
|
1198
|
164
|
|
2009
|
2992
|
1012
|
430
|
1365
|
185
|

GDP trend projection in 10 years beyond the period of the study
shows that GDP Current Prices will increase continually.

Beyond an abundance of consumer goods, the increase of GDP brings
other basic advantages. Those advantages include some important indicators of
well-being, including life expectancy, reduce in infant and child mortality
rates, number of doctors, measures of nutrition and education opportunity , all
those factors are captured in satellites accounts « education account,
Health account, Environmental account» and compiled with GDP from SUT.
GDP of Rwanda is related to economic well-being. One may conclude
from the list of important factors omitted from the official figures that GDP
is useless as a measure of income welfare. But as explained above GDP has a
closer relationship with Socio-Economic Well-being of Population.
|
GROSS DOMESTIC PRODUCT BY KIND OF ACTIVITY AT CONTANT
2006 PRICES (In Billion Frw)
|
|
YEARS
|
GDP
|
Agriculture
|
Industry
|
Services
|
Adjustments
|
|
1999
|
983
|
447
|
130
|
363
|
64
|
|
2000
|
1066
|
480
|
132
|
405
|
69
|
|
2001
|
1156
|
523
|
149
|
432
|
75
|
|
2002
|
1308
|
611
|
160
|
482
|
87
|
|
2003
|
1337
|
592
|
167
|
515
|
85
|
|
2004
|
1437
|
603
|
193
|
568
|
87
|
|
2005
|
1571
|
642
|
211
|
636
|
93
|
|
2006
|
1716
|
660
|
236
|
720
|
100
|
|
2007
|
1849
|
677
|
258
|
809
|
105
|
|
2008
|
2064
|
721
|
297
|
929
|
118
|
|
2009
|
2187
|
776
|
301
|
982
|
128
|
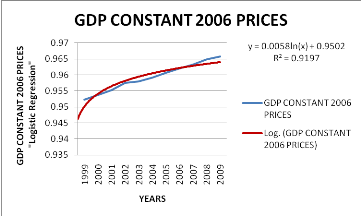
GDP trend projection in 10 years beyond the period of the study
shows that GDP Constant 2006 Prices will increase continually.

Clearly, in evaluating the effects a proposed economic policy,
considering only the likely effects on GDP is not sufficient. Planer must also
ask whether the policy will affect aspect of economic well-being that is not
captured in GDP. Environmental regulations may reduce the production of some
products as wood, fish, and pottery for example, consequences decrease of GDP;
but that factor is not sufficient basis on which to decide whether such
regulations are good or bad. The right way to decide that question is to apply
cost benefit principle.
Although looking at the effects of proposed policy on GDP is
not a good enough basis on which to evaluate a policy, GDP per capita in Rwanda
does not tend to be positively associated with many things people value,
including a high material standard of living, better health and expectancy, and
better education.
Those components show that SUT indicators are improved when
they are combined with other indicators from satellite accounts and all both
provide efficient indicators to measure economic development of Rwanda, by
noting that SUT is the causal model.
| 

