4.3. Human Development
Index Analysis
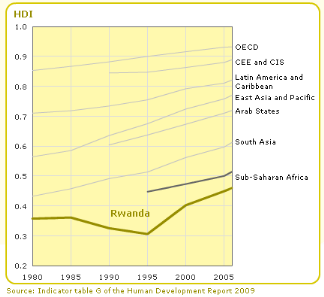
HDI trend deceased from 1985 to 1994 due to war. This decease
was explained by the low GDP per capital, decrease in life expectance and low
literacy level, Low investment, Low Export and high Import, Low productivity in
Agricultural sector, and this period was characterized by Gini coefficient of
28.9 (1980- ) which shows how the income was unequally distributed among
pupation.
HDI has increased from 1995 with the economic rehabilitation
and reorientation, from since economic activities were boosted and the
production begins to increase. These policies caused an increase in GDP per
capita and the recent figures show that GDP per capita was 213.9 current $ in
2000 and 258.8 Current $ in 2005 to reach 458.5 current $ in 2008. The Gini
coefficient increase from 28.9 in 1980 to 46.8 in 2007, with the life
expectance at birth of 51 years in 2009, and in Education data of 2005-2008
show a Primary-Secondary gross enrolment ratio of women and men per 100 of 89.7
and 98.6 respectively.
But, even though HDI experienced improvement, Rwanda is steal
classified in Low Human Development Index at Rank 167 in 2006 with HDI lower
than 0.5.
The Urban population growth from 2005 to 2009 is estimated at
4.2% against 2.4% in rural areas. These figures show that many persons in
Rwanda are concentrating in town where they are expecting good life (Sanitation
and Hygiene), and due to those factors in 2007 18% of population of Rwanda
lived in urban areas.
Those changes had been caused by the improvement in sectors
like Agriculture, Industry and Services sectors, and this contributed in GDP
growth ,where by the Gross Fixed capital formation was increased, the recent
figures show that the gross fixed capital formation Percentage of GDP was 18%
in 2000 to reach 22.7% in 2008, and in most of cases these sectors are well
developed in town rather than in rural areas here in Rwanda. For different
reasons these sectors provided job to population, this caused improvement in
Gini Coefficient and as consequences the Human Poverty index decreased rapidly
and was 32.9% in 2007.

If the HDI in Rwanda continue to increase as it was increasing
last 30 years, the HDI of Rwanda can exceed value of 0.5 in 25 beyond the
period of the study. But some changes can increase HDI as shown in graph above
such as the improvement of Agriculture sector which cover the important part of
Rwanda population, improvement of Industry sectors by increasing their capacity
of making value added on different products especial agro-products and this
factors has a significant role in increasing Export and reducing Import which
contrasts the economic development of Rwanda.

4.4. Environment quality
and resource depletion
Rwanda has recently experienced tremendous growth in GDP
current prices. But in expending its manufacturing base, it also has suffered a
severe decline in water and forest reserves. Increased pollution certainly
detracts from the quality of life, but because water and air are not sold in
markets, the GDP of Rwanda does not reflect this downside of their economic
growth. The exploitation of finite natural resources also tends to be
overlooked in GDP.
A number of efforts have been made to incorporate factors like
air quality and resource depletion into a comprehensive measure of GDP. Doing
so has been difficult, since it often involves placing a monetary unit value on
intangibles, like having clean river as it is the policy of Rwanda by
eradicating erosion, planting bamboos at least in 50 m from rives or lakes and
resource conservation are hard to measure even though forests conservations are
being developed by creating Nation Park to promote Tourism in Rwanda.
|
Environment
|
|
Threatened species
|
2009
|
53
|
|
Forested area (% of land area)
|
2007
|
21.7
|
|
CO2 emission estimates (000 metric tons and metric tons per
capita)
|
2006
|
795/0.1
|
|
Energy consumption per capita (kilograms oil equivalent)
|
2007
|
19
|
|
Rainfall, total mean (millimetres)
|
|
1028
|
| 

