CHAPTER FOUR: DATA PRESENTATION,
ANALYSIS AND INTERPRETATION
The purpose of this chapter is to present and analyse the
results of the studies conducted on the field. We will first give data
presentation. Then, we will direct the study towards interpretation of result
of SPSS regression analysis.
4.1 DATA PRESENTATION
4.1.1 Table2: EVOLUTION OF CPI,
M2, Real GDP, ER and LR (1990-2009)
|
SN
|
Years
|
Consumer Price Index (CPI)
|
Money Supply (M2)
(In millions Rwf)
|
Real GDP (Base Year: 2000)
(In millions of Rwf)
|
Exchange rate (ER) In US Dollars
|
Lending rate (LR) in %
|
|
01
|
1990
|
19.00
|
31,893.70
|
213,533.0
|
83.70
|
9.96
|
|
02
|
1991
|
22.70
|
33,730.30
|
239,310.0
|
125.16
|
13.65
|
|
03
|
1992
|
24.90
|
37,900.50
|
276,488.0
|
133.94
|
15.00
|
|
04
|
1993
|
28.00
|
37,966.30
|
284,368.0
|
144.24
|
13.61
|
|
05
|
1994
|
55.70
|
32,221.70
|
165,800.0
|
140.70
|
12.88
|
|
06
|
1995
|
55.70
|
62,645.00
|
339,143.0
|
262.18
|
16.07
|
|
07
|
1996
|
59.80
|
69,856.90
|
424,130.0
|
306.82
|
16.17
|
|
08
|
1997
|
67.00
|
90,163.60
|
558,281.0
|
301.53
|
16.22
|
|
09
|
1998
|
71.20
|
91,984.50
|
621,388.0
|
312.31
|
17.13
|
|
10
|
1999
|
69.40
|
98,056.30
|
606,991.0
|
333.94
|
16.84
|
|
11
|
2000
|
72.20
|
111,254.70
|
676,099.0
|
389.70
|
16.99
|
|
12
|
2001
|
74.60
|
121,418.20
|
741,872.0
|
442.99
|
17.29
|
|
13
|
2002
|
76.10
|
144,567.90
|
781,468.0
|
475.37
|
16.37
|
|
14
|
2003
|
81.70
|
167,523.50
|
955,164.0
|
537.66
|
17.05
|
|
15
|
2004
|
91.70
|
187,225.00
|
1,138,470.0
|
557.45
|
16.48
|
|
16
|
2005
|
100.00
|
218,372.30
|
1,332,910.0
|
557.82
|
16.07
|
|
17
|
2006
|
108.90
|
285,646.30
|
1,563,830.0
|
551.71
|
16.07
|
|
18
|
2007
|
118.80
|
375,273.50
|
1,866,120.0
|
546.96
|
16.19
|
|
19
|
2008
|
137.10
|
395,808.80
|
2,063,505.5
|
546.85
|
16.51
|
|
20
|
2009
|
146.60
|
404,365.40
|
2,187,000.0
|
568.00
|
16.49
|
Source: ECONSTATS, NBR, NISR (Annual reports:
2009; 2006; 2003; 2000; 1997; 1995)
4.2 DATA ANALYSIS AND
INTERPRETATION
4.2.1 Correlation between
variables
The correlation coefficient is a number between -1 and +1 that
measures both the strength and direction of the linear relationship between two
variables.
The magnitude of the number represents the strength of the
correlation. A correlation coefficient of zero represents no linear
relationship (the scatter plot does not resemble a straight line at all), while
a correlation coefficient of -1 or +1 means that the relationship is perfectly
linear (all of the dots fall exactly on a straight line).
The sign (+/-) of the correlation coefficient indicates the
direction of the correlation. A positive (+) correlation coefficient means that
as values on one variable increase, values on the other variable tend to also
increase; a negative (-) correlation coefficient means that as values on one
variable increase, values on the other tend to decrease, that is, they tend to
go in opposite directions.
A Scatter plot here was used to determine if there is
correlation between two variables. Moreover they are things to consider when
using scatter plots like that a direct or strong correlation does not
necessarily imply a cause-and-effect relationship. If a scatter plot shows
signs of correlation, investigate further for confirmation.
A. Correlation between Consumer
Price Index and Money Supply (M2)
1. Summary of output from SPSS regression analysis
between CPI and M2
|
Variables
|
Coefficients
|
t
|
P-Value
|
|
Constant
|
-3.119
|
-4.261
|
0.000
|
|
Money Supply (M2)
|
0.629
|
9.930
|
0.000
|
|
R = 0.92 Confidence intervals = 95%
F= 98.605 R Squared =0.846 Model significance = 0.000
|
2. Graph1: Trends in CPI and
M2, 1990-2009
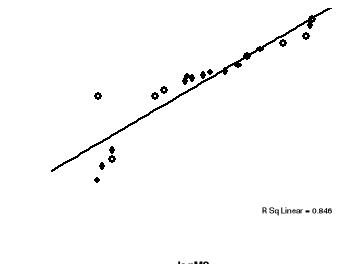
This scatter plot describes a positive trend; there is a weak
positive correlation between CPI and M2. In other words, the value of CPI
increases slightly as the value of M2 increases.
Thus, our regression analysis shows that the volume of money
supply is positively related to the consumer price index; coefficient has a
positive sign and also is statistically significant at 0.001 Since observed
t-value (9.930) lies in the critical region we reject the null hypothesis.
Therefore, we confirm the alternative hypothesis says that Money supply has a
significant positive effect on inflation rate in Rwanda.
It also shows results from an increase of one unit of Money
supply would result to an increase in Consumer price index by 62.9 %.
|
|


