4.2.2 Regression equation of the model
1. Summary of output from SPSS regression
analysis of multivariate
|
Variables
|
Coefficients
|
t
|
P-Value
|
|
Constant
|
0.430
|
0.267
|
0.793
|
|
Money Supply (M2)
|
1.706
|
3.981
|
0.001
|
|
Real GDP (GDP)
|
-1.476
|
-3.603
|
0.003
|
|
Exchange Rate (ER)
|
0.297
|
1.092
|
0.292
|
|
Lending Rate (LR)
|
0.733
|
1.192
|
0.252
|
|
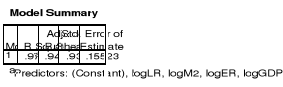
R = 0.972 Confidence intervals = 95% F=
64.470
R Squared = 0.945 Model significance = 0.000
|
Examining the output from this regression analysis; we look to
the p-value of the F-test to see if the overall model is significant. With a
p-value of zero to three decimal places, the model is statistically
significant. The R-squared is 0.945, meaning that approximately 94.5% of the
variability of CPI is accounted for by the variables in the model. In this
case, the adjusted R-squared indicates that about 94.5% of the variability of
CPI is accounted for by the model; even after taking into account the number of
predictor variables in the model. As explained below, the coefficients for each
of the variables indicates the amount of change one could expect in CPI given a
one-unit change in the value of that variable, given that all other variables
in the model are held constant.
In order to arrive at a more efficient model, variables with
low t-values or incorrect signs in the over-parameterized regression were
excluded.
2.
Specification of general model
CPI = 0.43 M21.706
GDP-1.476 ì
Log CPI= 2.7 +1.706 log M2 +1.476 log GDP+
ì
3. Predictive accuracy of the general model
One way to measure the overall predictive accuracy of a
multiple regression model is the R-square value. The interpretation of R-square
is: "The amount of variance in the dependent variable that can be explained by
the model." For our model the R-square value is 0.945, this means the model
explains 94.5% of the variance and so the model will produce perfect predictive
accuracy. The point is, the closer to 1.0 the R-square value is, the better the
model. The closer the R-square value is to 0, the worse the model.
| 

