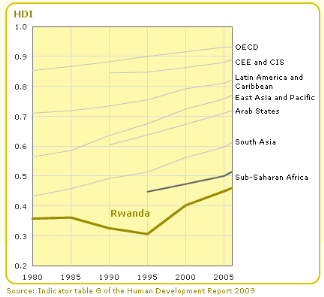
4.5.5. Human Development Index
Analysis
HDI trend decreased from 1985 to 1994 due to war. This
decrease was explained by the low GDP per capital, decrease in life expectance
and low literacy level, Low investment, Low Export and high Import, Low
productivity in Agricultural sector, and this period was characterized by Gini
coefficient of 28.9 (1980) which shows how the income was highly unequally
distributed among pupation.
HDI has increased from 1995 with the economic rehabilitation
and reorientation, from since economic activities were boosted and the
production begins to increase. These policies caused an increase in GDP per
capita and the recent figures show that GDP per capita was 213.9 current $ in
2000 and 258.8 Current $ in 2005 to reach 458.5 current $ in 2008. The Gini
coefficient increase from 28.9 in 1980 to 46.8 in 2007, with the life
expectance at birth of 51 years in 2009, and in Education data of 2005-2008
show a Primary-Secondary gross enrolment ratio of women and men per 100 of 89.7
and 98.6 respectively. But, even though HDI experienced improvement, Rwanda is
steal classified in Low Developed Countries at Rank 167 in 2006 with HDI lower
than 0.5 (Republic of Rwanda, NISR: Statistical Yearbook 2009: 5-121; Human
Development Report 2009).
Figure 4.2. Human
Development Index Trend (1980-2005)
The Urban population growth from 2005 to 2009 was estimated to
4.2% against 2.4% in rural areas. These figures show that many person in Rwanda
are concentrating in town where they are expecting good life (Sanitation and
Hygiene), and due to those factors in 2007, 18% of population of Rwanda lived
in urban areas. And the large wage gap between rural and urban population,
especially for unskilled and semiskilled labour, is the main cause of that
dramatic increase in number of people living in urban areas in Rwanda.
Consequently, this movement has an important contribution in
redressing rural development, because flow of formal transfers from people
living in urban areas back to their rural region of origin has been increased
rapidly and has become the larges source of capital for many rural areas in
Rwanda.
Figure 4.3. Evolution of
Human Development Index
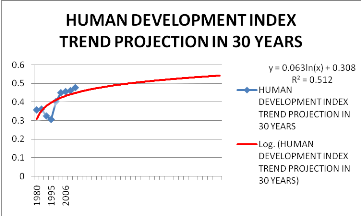
If the HDI in Rwanda continue to
increase as it was increasing last 30 years, the HDI of Rwanda can exceed value
of 0.5 in 30 years beyond the period of the study.
| 

