4.6. Challenges in information provided by Linear Model
From the analysis of SUT and IO-T and Linear Model, it is
remarkable that Linear Model does not provide sufficient information necessary
to measure the role of System of National Accounts in the perspective analysis
of economic development of Rwanda. The main challenge encountered by the Linear
Model is the lack of information in Intermediate Consumption by Product and by
Industry. This information is the main intra in the so-called central equation
system for input-output analysis which offers multiple approaches for analysis.
Mathematically, this equation is defined as Z =
B*(I-A)-1F, where B is a
matrix of input coefficients for a specific variable (intermediate uses, labor,
capital, energy, emissions, etc.), (I-A)-1 stands
for the Leontief inverse, F represents a diagonal
matrix for final demand and Z a matrix with results
for direct and indirect requirements (intermediates, labor, capital, energy,
emissions, etc.). Basically, this approach would provide quantitative
assessment (José M. Rueda-Cantuche et al., 2005: 8; Eurostat, 2002).
The following analysis tried to estimate SUT and IO-T for
Rwanda in 2007 basing on the main indicators provided by Linear Model.
Information not provided by Linear Model are highlighted in order to show its
deficiency and to demonstrate that with Linear Model it is not easy to perform
central equation system for input-output analysis. In order to estimate those
tables some assumption had been stated and some Ratios had been fixed in order
to estimate attached indicators:
· The row and column items were computed basing on
percentages of GDP decomposition by sectors [Services 46%, Industry 14%, and
Agriculture 40 (John RWIRAHIRA, 2008: 11)].
· Each Product is produced in its own specific way,
irrespective of the industry where it is produced.
· Each industry has its own specific way of production,
irrespective of its product mix.
· Input in each sector and Production from each sector
were estimated basing on that Intermediate consumption was 122.8 % of GDP and
Production was 212.87% of GDP (AfDB-EIU-UNIDO Infobase-World Bank-Wold Economic
Forum-World Factor Book, 2008: 1-2;
htt://www.docstoc.com/docs/48810565/RWANDA--Kigali)
· The distribution of Intermediate Consumption and
Production was based on percentage of GDP decomposition by Sectors
(Agriculture, Industry, and Services).
Table 4.4. Estimated
Simplified Supply and Use Framework of Rwanda in Billion Frw (in Constant 2006
Prices)
|
|
Products
|
Industries
|
Final Uses
|
Total
|
|
Agricult. Products
|
Industrial Products
|
Services
|
Agri-culture
|
Industry
|
Service Activities
|
Final Con- sumption
|
Gross Capital Formation
|
Exports
|
|
Products
|
Agricult. products
|
|
334
|
117
|
384
|
728
|
138
|
78
|
1778
|
|
Industrial products
|
117
|
41
|
134
|
255
|
48
|
27
|
622
|
|
services
|
384
|
134
|
442
|
837
|
158
|
89
|
2044
|
|
Industries
|
Agriculture
|
630
|
220
|
724
|
|
|
1574
|
|
Industry
|
220
|
77
|
253
|
551
|
|
Service Activities
|
724
|
253
|
833
|
1811
|
|
Value Added
|
|
740
|
259
|
851
|
|
1849
|
|
Imports
|
204
|
71
|
234
|
|
|
509
|
|
Total
|
1778
|
622
|
2045
|
1574
|
551
|
1811
|
1819
|
344
|
194
|
10738
|
The above
Estimated simplified SUT shows the information which are not easily available
in Rwanda, those information are: Input, Production, Final use, Value Added,
and Import Matrices, even though they are available in single element for
example, Import Total is available but import by products is not available,
Export Total is available but Export by Product is not available in clean
forms, Value Added Total is available but Value Added by Industry in not easily
available because they are available in percentages of GDP. Those are the
weakness of not using integrated SUT and IO-T. The part in yellow is not
applicable.
Table4. 5. Estimated
Simplified Symmetric input-output table (product by product) of Rwanda in
Billion Frw (Constant Price)
|
Products
|
Products
|
Final Uses
|
Total
|
|
Agricult. Products
|
Industrial Products
|
Services
|
Final Con- sumption
|
Gross Capital Formation
|
Exports
|
|
Agricult. products
|
334
|
117
|
384
|
728
|
138
|
78
|
1778
|
|
Industrial products
|
117
|
41
|
134
|
255
|
48
|
27
|
622
|
|
services
|
384
|
134
|
442
|
837
|
158
|
89
|
2044
|
|
Value Added
|
740
|
259
|
851
|
|
1849
|
|
Import
|
204
|
71
|
234
|
|
509
|
|
Supply
|
1778
|
622
|
2045
|
1819
|
344
|
194
|
6802
|
From SUT a Simplified Symmetric Input-Output Table was
estimated, the information from this IO-T were used in the estimation of Input
Coefficients in order to perform further analysis related to economic
development, even though the analysis in this study was limited on the use of
Input Coefficients further analysis for economic development may be based on
those table and on the Input Coefficients Matrix through many techniques to
evaluate the quality of life such as: Linkage, Activity Specification, and
Dummy Sector Technique.
Apart from those techniques STU and IO-T are the basic steps
in constructing SAM, because most of the details from those tables are carried
over without modification to SAM, where there are reassembled in Matrix form
(GRAHAM Pyatt, 1999: 365-386), and SAM has an important advantages on analyzing
Economic development of an economy, among them: reduction of risk of confusion,
and it emphases on consistence and the importance of complete articulation,
both of which are the essence in trying to understand feedback systems, in
general, and the interdependence of the distribution of income and the
structure of income, in particular.
Table4.6
Input Coefficients
|
Products
|
Products
|
|
Agricult. Products
|
Industrial Products
|
Services
|
|
Agricult. products
|
0.19
|
0.19
|
0.19
|
|
Industrial products
|
0.07
|
0.07
|
0.07
|
|
services
|
0.22
|
0.22
|
0.22
|
|
Import
|
0.11
|
0.11
|
0.11
|
|
Wages, Salaries etc. + Oper. Srplus
|
0.42
|
0.42
|
0.42
|
|
Supply
|
1
|
1
|
1
|
The Input
Coefficients were computed in order to highlight the role of using Leontief
inverse in the perspective economic analysis, its role is not only limited in
the central equation system for input-output analysis but also it may be used
to measure ecosystem structure and function, sensitivity, Cycling, dependence
and contribution effects between compartments, loop analysis tropic dynamics,
and self-organization (Manfred Lenzen, 2006: 334-342).
These
analyses are efficient to measure economic development of an economy, but due
to the non availability of that information in Rwanda, those depth analyses are
not done, therefore its use in economic development is still under considered.
The Leontief inverse can play a consolidated role in economic development of
Rwanda as it has a multiple uses.
Through this study its consolidated role was shown in central
equation system for input-output analysis to balance production by Products and
by Industry and in output function to measure the impact of increasing or
decreasing intensity of Input Coefficients in an economy.
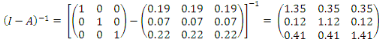
Leontief inverse = (I-A)-1
4.6.1. Use of central equation
system for input-output analysis
Z = B*(I-A)-1F

The above function is used as a central equation system for
input-output analysis which offers multiple approaches for analysis. After
verifying that the production provided using the above equation basing on Input
Coefficient Matrix, Leontief Inverse Matrix, and Diagonal Matrix of Final
Demand is equal to the production Matrix in the above Simplified Supply and Use
Table, therefore further analysis may be made and (Z) Matrix can be useful when
analyzing the impact of how the increase in Input will influence the Total
production within the whole economy (José M. Rueda-Cantuche et al.,
2005: 8).
| 

