4.6.2. Use of output function
to measure the impact of increasing or decreasing intensity of Input
Coefficients
X = B* *
(I-A)-1y
B is a row vector matrix from Matrix
A for Agriculture, Industry, and Services, and
B* Matrix is equal to Matrix A (Input
Coefficients Matrix) (Eurostat, 2002: 17-23).
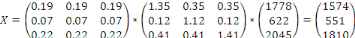
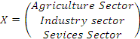
X = Output from Sectors which contribute in production within an
economy.
Basing on the equation system for input-output analysis,
Output from each sector can be computed, and the above equation provide total
production in the three sectors, and the solution is the same as the figures in
Supply and Use Tables.
Through this study the focus was made only on the policy of
increasing Input Coefficients from product (i) to industry (j). The policy used
in this study was to test the impact of fixing input coefficients on 0.30 for
each coefficient other things held constant, in order to see how this policy
may or will influence the production basing on the production of 2007.
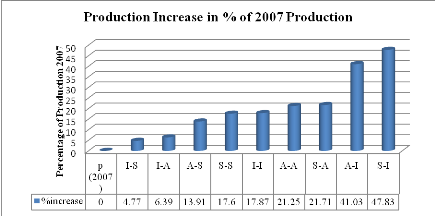
The results of this policy are stated in the following table,
and the highlighted column contain the higher production; therefore this policy
will be efficient when the Coefficient from Services (product) to Industry
(industry) (S-I) is increased and at this stage the production
will be maximized basing on the Input and Production Matrices of 2007. This
means that the increase of services Inputs in Industrial sector has a positive
effect to increase economic capacity of Rwanda.
Table 4.7. Changes in Input
Coefficients
|
|
Period 1
|
The Impact of Increasing Input Coefficients to 0.3 on
Sectoral Production
|
|
P (2007)
|
A-A
|
I-A
|
S-A
|
A-I
|
I-I
|
S-I
|
A-S
|
I-S
|
S-S
|
|
Agriculture S.
|
1574
|
2174
|
1754
|
2187
|
1877
|
1706
|
1927
|
1676
|
1609
|
1704
|
|
Industry S.
|
551
|
606
|
567
|
607
|
1513
|
970
|
1673
|
587
|
563
|
596
|
|
Services S.
|
1810
|
1990
|
1864
|
1994
|
2158
|
1962
|
2216
|
2218
|
1950
|
2327
|
|
Total Product.
|
3934
|
4770
|
4186
|
4788
|
5548
|
4637
|
5816
|
4481
|
4122
|
4627
|
Assuming that the Input-Output Coefficients as derived from
Input-Output Table remain more or less constant for a certain period of time
(say a couple of years), they may in a meaningful way be used in so called
Input-Output Models or Inter-Sectoral Models, which describe the relationship
between the output of various branches on the one hand and their different
input requirements on the other hand as used in the above analysis. Such kind
of models may play a role in different types of analysis related to policy
preparation and planning in Rwanda as shown in this research, and input out put
approach would be a powerful too in analyzing and planning process of economic
development and industrial growth in Rwanda.
Figure 4.4. Change in
Production due to Changes in Input Coefficients (2007 Basic
Years)
Due to the lack of information in SUT and IO-T this analysis
is not easy to apply on the economy of Rwanda, the results from the analysis of
economy basing on STU and IO-T stipulates that is the increase in production
which determine the quantity to Export and/ or the quantity to import, the
evolution of industry sector and its contribution to development, and the
improvement of the increasing in production of Services Sector has an important
impact when analysing satellite accounts such heath, environmental, and Tourism
satellite accounts.
Table 4.8. Used Abbreviations
|
P(2007)
|
Basic Production base Year 2007
|
|
A-A
|
Agriculture Inputs in Agriculture Sector
|
|
I-A
|
Industry Inputs in Agriculture Sector
|
|
S-A
|
Services Inputs in Agriculture sector
|
|
A-I
|
Agriculture Inputs in Industry Sector
|
|
I-I
|
Industry Inputs in Industry Sector
|
|
S-I
|
Services Inputs in Industry Sector
|
|
A-S
|
Agriculture Inputs in Services Sector
|
|
I-S
|
Industry Inputs in Services Sector
|
|
S-S
|
Services Inputs in Services Sector
|
| 

