IV. Is the Foreign Cross-Listing Efficient ?
IV.1. Empirical Determination of the Efficiency
The current globalisation of financial markets implies a
greater mobility of capital, an easier access to the main financing markets,
the emergence of new trading facilities and a standardisation of the corporate
governances.
After the analysis over the last years of the reasons given
by companies announcing a foreign cross-delisting, it emerges that the notion
of "efficiency" is most of time associated with "significant trading
volumes".
|
#27: Recent Foreign Cross-Delistings
|
Rationales behind the delisting (sources
company)
|
Company
|
Country
|
Dates
|
Delisting from
|
Low trading
volumes
|
Costs
|
Administrative
complexity
|
Deregulation of
capital markets
|
|
|
|
|
|
|
|
|
Volvo
|
Sweden
|
2001
|
Tokyo SE
|
|
|
|
|
|
|
2003
|
Euronext Brussels
|
|
|
|
|
|
|
2003
|
Frankfurt
|
|
|
|
|
|
|
2004
|
L.S.E
|
|
|
|
|
|
|
2007
|
Nasdaq
|
|
|
|
|
LVM H
|
France
|
2002
|
Nasdaq
|
|
|
|
|
|
|
2003
|
Euronext Brussels
|
|
|
|
|
Nokia
|
Finland
|
2003
|
L.S.E
|
|
|
|
|
|
|
2004
|
Euronext Paris
|
|
|
|
|
|
|
2007
|
OMX Stockholm
|
|
|
|
|
Lafarge
|
France
|
2004
|
L.S.E
|
|
|
|
|
|
|
2004
|
Frankfurt
|
|
|
|
|
|
|
2007
|
Nyse
|
|
|
|
|
Bombardier
|
Canada
|
2004
|
Euronext Brussels
|
|
|
|
|
|
|
2005
|
Frankfurt
|
|
|
|
|
ABB
|
Switzerland
|
2005
|
L.S.E
|
|
|
|
|
|
|
2005
|
Frankfurt
|
|
|
|
|
Euro Disney
|
France
|
2005
|
L.S.E
|
|
|
|
|
|
|
2005
|
Euronext Brussels
|
|
|
|
|
K Line
|
Japan
|
2005
|
Euronext Brussels
|
|
|
|
|
|
|
2005
|
Frankfurt
|
|
|
|
|
Vivendi
|
France
|
2006
|
Nyse
|
|
|
|
|
RSA Insurance
|
U.K
|
2006
|
Nyse
|
-
|
-
|
-
|
-
|
Pioneer
|
Japan
|
2006
|
Nyse
|
|
|
|
|
|
|
2006
|
Euronext Amsterdam
|
|
|
|
|
|
|
2006
|
Osaka SE
|
|
|
|
|
Ahold
|
Netherlands
|
2007
|
Nyse
|
|
|
|
|
BASF
|
Germany
|
2007
|
Nyse
|
|
|
|
|
Fiat
|
Italy
|
2007
|
Nyse
|
|
|
|
|
E.ON
|
Germany
|
2007
|
Nyse
|
|
|
|
|
Technip
|
France
|
2007
|
Nyse
|
|
|
|
|
Danone
|
France
|
2007
|
Nyse
|
|
|
|
|
British Airways
|
U.K
|
2007
|
Nyse
|
|
|
|
|
Suez
|
France
|
2007
|
Nyse
|
|
|
|
|
Akzo Nobel
|
Netherlands
|
2007
|
Nasdaq
|
|
|
|
|
Telenor
|
Norway
|
2007
|
Nasdaq
|
|
|
|
|
Arcadis N.V.
|
Netherlands
|
2007
|
Nasdaq
|
|
|
|
|
Scor
|
France
|
2007
|
Nyse
|
|
|
|
|
Swisscom
|
Switzerland
|
2007
|
Nyse
|
|
|
|
|
Adecco
|
Switzerland
|
2007
|
Nyse
|
|
|
|
|
BG Group PLC
|
U.K
|
2007
|
Nyse
|
|
|
|
|
|
(following, on the next page)
(following of the previous page)
|
|
Rationales behind the delisting (sources
company)
|
Company
|
Country
|
Dates
|
Delisting from
|
Low trading
volumes
|
Costs
|
Administrative
complexity
|
Deregulation of
capital markets
|
|
|
|
|
|
|
|
|
Bayer
|
Germany
|
2007
|
Nyse
|
|
|
|
|
|
|
2008
|
Tokyo SE
|
|
|
|
|
Boeing
|
U.S
|
2008
|
Tokyo SE
|
|
|
|
|
Ducati Motor
|
Italy
|
2008
|
Nyse
|
|
|
|
|
Societe Generale
|
France
|
2008
|
Tokyo SE
|
|
|
|
|
Dassault Syst.
|
France
|
2008
|
Nasdaq
|
-
|
-
|
-
|
-
|
Altria Group
|
U.S
|
2008
|
Euronext Paris
|
|
|
|
|
Telefonica
|
Spain
|
2008
|
Euronext Paris
|
|
|
|
|
|
|
2008
|
Frankfurt
|
|
|
|
|
BP Plc
|
U.K
|
2008
|
Nyse Arca & Chicago
|
-
|
-
|
-
|
-
|
|
|
2008
|
Toronto SX
|
|
|
|
|
|
|
2008
|
Tokyo SE
|
|
|
|
|
|
|
2009
|
Swiss SX
|
-
|
-
|
-
|
-
|
Boeing
|
U.S
|
2008
|
Tokyo SE
|
|
|
|
|
Bosch
|
Germany
|
2008
|
Tokyo SE
|
-
|
-
|
-
|
-
|
Barclays Plc
|
U.K
|
2008
|
Tokyo SE
|
|
|
|
|
KPN
|
Netherlands
|
2008
|
Nyse
|
|
|
|
|
|
|
2008
|
L.S.E
|
|
|
|
|
|
|
2008
|
Frankfurt
|
|
|
|
|
Ericsson
|
Sweden
|
2008
|
L.S.E
|
|
|
|
|
AnheuserBush*
|
U.S
|
2008
|
L.S.E
|
|
|
|
|
Alcatel-Lucent
|
France
|
2008
|
Tokyo SE
|
|
|
|
|
ING Groep
|
Netherlands
|
2009
|
Euronext Paris
|
|
|
|
|
|
|
2009
|
Frankfurt
|
|
|
|
|
|
|
2009
|
Zurich
|
|
|
|
|
BNP Paribas
|
France
|
2009
|
Tokyo SE
|
|
|
|
|
|
85.5% 51.6% 12.9% 24.2%
* delisting announcement was made on March 2008, whereas the
takeover by InBev was announced in June 2008 Sources: Companies
The previous exhibit #27 underpins that in the very great
majority of foreign cross-delisting cases, companies' management are used to
pointing out the low trading volumes (85.5%). As regards the second most evoked
rationale, the costs (51.6%) stem from the low trading volumes since the
management highlight the weak relevance to pay such costs for insignificant
trading volumes. Managers estimate that volumes on foreign stock exchanges no
longer justify a broad range of foreign cross-listings. The findings deriving
from the previous analysis allow us to determine the operational definition of
the efficiency.
Operational definition of an efficient foreign cross-listing
In this research, we consider a foreign cross-listing as
efficient, from the moment that the volumes and the liquidity on the foreign
listing place are "significant" in comparison to those on the primary listing
place.
In this research, "significant" implies a free-float rotation
higher than 0.1% and volumes accounting for more than 5% of the total
volumes.
However a question remains without answer. Do the notions of
volume and liquidity overshadow all the advantages provided by foreign
cross-listings and enounced in part 1.3. Reasons Pleading for Foreign
Cross-Listing ? According to the companies' managements, the answer is in the
very great majority 'yes". Undeniably, nowadays it appears that some
advantages, true in the past, have become operationally negligible or no more
relevant.
As regards the reduction of volatility and transaction costs
that may provide a foreign cross-listing, the on-going evolution initiated by
new trading platforms (see part 111.3. A New Deal in the World of Stock
Exchanges 1ndustry) helps to improve all two points. Indeed, the increasing
competition between traditional and alternative trading platforms improves the
trading effectiveness, reduces the volatility by making shares accessible for a
largest panel of investors, and lowers the transaction costs. Foreign
cross-listings are not anymore the only one solution to improve these
points.
Furthermore, the idea that a foreign cross-listing allows to
access to new investors and to broaden shareholders basis remains true, but the
contrary is not necessarily true. As we have already noticed, nothing is more
mobile than the capital, which may easily and rapidly move from one financial
place to another one. Hence, by taking into consideration this fact, not being
cross-listed does not prevent companies from accessing foreign investors
because investors are more and more mobile. Nowadays, roles have been reversed,
i.e. it is not anymore the company that reaches investors, but investors that
reach the company. To some extent, this situation is more convenient.
Concerning the business motivations (visibility, notoriety,
relations with clients/suppliers) and the corporate governance motivations
(gain in media and analyst coverage, facilitate M&A operations with foreign
companies), it is quite difficult to materialize and to quantify their
advantages. But we may consider that from the companies' management point of
view, these elements are secondary considerations in the decision of the
foreign cross-listing.
Differences Between Stock Exchanges
Since we have noted that the notions of liquidity and volumes
are the most important elements in the management's decision for a foreign
cross-delisting, it may be relevant to compare the liquidity by main stock
exchanges.
#28: Rationales Behind the Delisting
Low trading Costs Administrative Deregulation
of
volumes complexity capital markets
Cases in which the
rationale is evoked
|
84.2% 42.1%
|
12.3% 21.1%
|
Sources: Companies
|
|
|
|
As stated B. Kadlec and J. McConnell48, some
financial markets like New York and London provide a better liquidity thanks to
a greater competition between actors which implies a fall of transaction costs
and an increase of the trading activity.
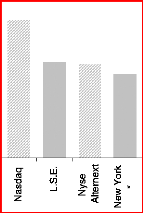
#29: 2007 Liquidity49 on each Stock Exchange
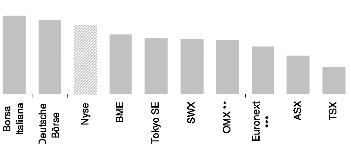
0.86% 0.82% 0.76%
0.65% 0.61% 0.60% 0.59%
0.52%
0.42%
0.30%
1.52%
1.06% 1.04%
0.92%
Sources: World Federation of Exchanges, ThomsonReuters
Datastream
* includes the Nyse, the Nasdaq and the Nyse
Alternext
** includes the Copenhagen, Helsinki, Iceland, Stockholm,
Tallinn, Riga and Vilnius Stock Exchanges *** includes Euronext Paris, Euronext
Amsterdam, Euronext Brussels, Euronext Lisbon
According to the exhibit #29, the Nasdaq appears to be by far
the most efficient stock exchange in terms of liquidity, followed by the L.S.E
and the Nyse Alternext. Regarding Borsa Italiana, it is important to mitigate
its figures and its honorable 0.86% by regarding the relatively "weak" total
market capitalisation of the Italian place in comparison to the Italian GDP.
48 B. Kadlec and J. McConnell, 1994, "The Effect of
Market Segmentation and Illiquidity on Asset Prices Evidence from Exchange
Listings"
49 Average Daily Turnover in US$ / Total Market
Capitalisation in US$
| 

