IV.2. Liquidity Analysis
As we noticed in the previous part, companies' managements
are used to considering a foreign cross-listing as a success from the moment
that there are sufficient volumes and liquidity. Henceforth the notion of
"efficiency" had been defined and we are going to test this point thanks to the
sample we had retrieved in the chapter II. The Geography of Foreign
Cross-Listings. For this reason, we are focusing the analysis on the market
activity of foreign cross-listed companies, in terms of volume and liquidity on
each listing place.
To materialize the notion of liquidity, we will use the
free-float rotation.
Free-float rotation formula:
6-Months Average of Daily Volumes (in shares)
Free-Float Rotation (FFR) =
% of the Free-Float x Number of shares in the Capital
|
|
#30: Free-Float Rotation of Foreign Cross-Listings Composing the
Sample
|
FFR
on the Primary
Stock Exchange
|
Average
|
0.618%
|
Median
|
0.479%
|
Nyse
|
0.624%
|
Nasdaq
|
0.363%
|
Nyse Alternext
|
0.256%
|
L.S.E
|
0.574%
|
Paris
|
0.902%
|
Frankfurt
|
0.774%
|
Swiss
|
0.619%
|
Amsterdam
|
0.644%
|
Madrid
|
0.821%
|
OMX
|
0.626%
|
Milan
|
0.816%
|
Australia
|
0.587%
|
Tokyo
|
0.879%
|
|
FFR
on the Foreign
Stock Exchange
|
Delta*
(in %)
|
Average
|
0.261%
|
57.8%
|
Median
|
0.042%
|
91.2%
|
Nyse
|
0.43053%
|
31.0%
|
Nasdaq
|
0.60798%
|
-67.4%
|
Nyse Alternext
|
0.35539%
|
-38.8%
|
L.S.E
|
0.06946%
|
87.9%
|
Paris
|
0.05549%
|
93.8%
|
Frankfurt
|
0.00795%
|
99.0%
|
Swiss
|
0.00113%
|
99.8%
|
Amsterdam
|
0.17350%
|
73.1%
|
Madrid
|
0.03515%
|
95.7%
|
OMX
|
A 1 1 /VICO/
|
0/1 A0/
|
|
urr-.-r I..,
|
Milan
|
0.06762%
|
91.7%
|
Australia
|
0.14253%
|
75.7%
|
Tokyo
|
0.00014%
|
100.0%
|
|


*Delta = (FFR on the Primary Stock Exchange - FFR on the
Foreign Stock Exchange) / FFR on the Primary Stock Exchange
Source: ThomsonReuters Datastream

Not relevant because not enough data
Note: in the exhibit #30, the column FFR on the Foreign Stock
Exchange represents the average free-float rotation of foreign companies
cross-listed on these places, whereas the other column FFR on the Primary Stock
Exchange represents the free-float rotation of the same companies on their
primary listing place.
Interpretation of the figures:
As we may notice, only foreign cross-listings in the United
States provide significant volumes in comparison to those on the primary
listing places. Most striking is the overall greater liquidity of foreign
companies foreign cross-listed on the Nasdaq (delta of -67.4%), thereby
becoming most of time the primary trading place. We may notice the same
phenomenon on Nyse Alternext with a delta reaching -38.8%.
A contrario, the liquidity of foreign shares in Tokyo remains
very poor and negligible with a delta of almost 100%. Although European
countries provide better liquidity level than in Japan for foreign shares
(L.S.E delta at 87.9%, OMX delta at 82.4%, Paris delta at 93.8%), it remains at
weak levels in comparison to those performed on the American markets.
However, according to the results we have two intermediate
cases: Amsterdam and Australia. The first one, Amsterdam, presents higher
liquidity for foreign shares thanks to the strong presence of Dutch origin
multi-national companies such as the Belgian-Dutch Fortis and Galapagos, the
French-Dutch UnibailRodamco and AirFrance-KLM, the
French-Dutch-Luxembourgian-Spanish ArcelorMittal, the Anglo-Dutch Royal Dutch
Shell, Logica, Unilever and Reed Elsevier), the Swedish-Dutch LBI
International, and so on.
As regards Australia, two factors have to be taken into
consideration. Firstly, the large presence of Anglo-Australian companies
operating in the basic resources sector. Secondly, the role hold by the
Australian Stock Exchange as the most attractive place in the Oceania region,
thus becoming the main trading market of numerous New Zealand companies.
#31: Free-Float Rotation of Cross-Listings in Europe
Extra-European Cross-Lisitngs: * Intra-European
Cross-Lisitngs: **
FFR of non-European FFR of European
companies companies
L.S.E
|
0.070%
|
0.071%
|
Paris
|
0.019%
|
0.057%
|
Frankfurt
|
0.026%
|
0.012%
|
Swiss
|
0.001%
|
0.001%
|
Madrid
|
0.002%
|
0.035%
|
Milan
|
n.a.
|
0.001%
|
OMX
|
n.a.
|
n.a.
|
|
Source: ThomsonReuters Datastream
* Intra-European Cross-Listings: European companies
performing cross-listings in Europe
** Extra-European Cross-Listings: non-European companies
performing cross-listings in Europe
A more precise look at the liquidity in Europe brings to
light that both intraEuropean and extra-European cross-listings provide poor
liquidity, reinforcing the idea of the on-going integration of European capital
markets and the fall of borders for the capital movement.
However, after analyzing a crop of important cross-border
merger operations (such as SAS, Alcatel-Lucent, Carnival, Dexia, ABB,
AstraZeneca, Nyse Euronext, G4S, STMicroelectonics, AirFrance-KLM, Reed
Elsevier, BHP Billiton, Rio Tinto, Unibail-Rodamco, Nordea Bank, Inbev,
ThomsonReuters, EADS, and so on), it emerges an average free-float rotation of
0.768%, as well as a significant delta of 59.67%. Hence, we may admit that in
case of foreign cross-listings resulting from merger operations, it generally
complies with our efficiency definition.
#32: Breakdowns of the Free-Float Rotations
On the Secondary Stock Exchange On the Primary Stock Exchange
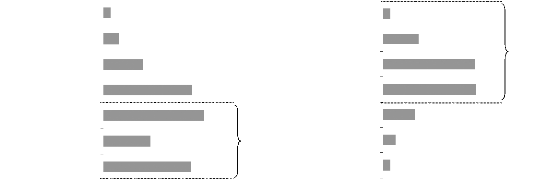
2.6%
12.8%
81.8%
33.0%
33.4%
11.3%
4.3%
More than 2%
Between 1% - 2%
Between 0.5% - 1%
Between
0.1% - 0.5%
Between 0.01% - 0.1%
Between 0.001% - 0.01%
Below
0.001%
More than 2%
Between 1% - 2%
Between 0.5% - 1%
Between 0.1% - 0.5%
Between 0.01% - 0.1% 60.9% Between 0.001% - 0.01%
Below 0.001% 2.6%
1.8%
3.9%
10.3%
23.1%
12.1%
22.7%
26.1%
Source: ThomsonReuters Datastream
The two previous exhibits #32 illustrate and reinforce the
idea that the liquidity is generally better on the primary stock exchange;
81.8% of cases presenting FFRs at substantial level, i.e. higher than 0.1%. A
contrario, the majority of second cross-listings offer poor performances, since
60.9% of cases provide a liquidity level below 0.1%.
To conclude with this part dealing with the liquidity, it
emerges that most of foreign cross-listings are inefficient. According to a
liquidity matter, only 39.1% of cases comply with the liquidity condition in
the efficiency definition, and a closer look at the results shows that outside
the United States this number drops to 12.3%.
Finally, only specific cases of foreign cross-listings present
good results:
4 Foreign cross-listings resulting from merger operations
between companies originally listed in two different countries
4 A majority of foreign cross-listings in the United States
| 

