IV.3. Volumes Analysis
IV.3.a. Analysis of the Efficiency
Following the definition of Efficiency, we will now test the
second part dealing with the volumes.
#33: Volumes Comparison Between Primary
and Secondary Stock
Exchanges
Average share in the total volumes
Cross-listed companies Primary Foreign
Stock Exchange Stock Exchange
US companies (listed on Nyse)
(listed on Nasdaq)
British companies
99.78% 0.11%
99.02% 0.55%
73.41% 20.17%
French companies 89.68% 3.89%
German companies 96.92% 1.14%
Swiss companies 91.62% 4.52%
Australian companies
|
66.69% 33.31%
|
|
Japanese companies 96.48% 3.52%
Source: ThomsonReuters Datastream
As we may notice, the results lead to major differences between
countries.
First of all, as regards American companies the trading
activities of their foreign cross-listings appears to be very limited,
representing on average a share of 0.11% (Nyse Companies) and 0.55% (Nasdaq
companies) in the total of volumes. Although foreign cross-listings performed
by American companies represent almost 20% of all foreign cross-listings, they
provide poor efficiency. The very great majority of volumes are traded on the
Nyse and on the Nasdaq.
As regards British companies, two different kinds of cases occur
and explain such levels of foreign trading activities.
On the one hand, for several decades many British companies
have initiated cross- border mergers, paving the way to the creation of
British-based multinational companies such as AstraZeneca (British-Swedish),
BHP Billiton and Rio Tinto (British-Australian), Carnival and GlaxoSmithKline
(British-American), Eurasian Natural Resources Corp (British-Kazakh), G4S
(British-Danish), HSBC Plc (BritishChinese), Anglo American Plc, Old Mutual and
SABMiller (British-South African), Royal Dutch Shell, Reed Elsevier and
Unilever (British-Dutch), and so on. Nowadays, 20% to 50% of these groups'
volumes are traded on a secondary stock exchange, establishing an average of
20.17% whatever the foreign stock exchanges.
On the other hand, British companies are widely cross-listed
in the United States, and more especially on the Nyse. According to the exhibit
#34, cross-listings of British companies in the United States represent on
average a share of 10.6% in total trading volume.
#34: Some Cases of British Companies Volumes Breakdown
Com pany Stock % of Com pany Stock % of
Exchange Volumes* Exchange
Volumes*
Barclays
|
London 91.9% Royal Dutch Shell London 32.6%
New York 7.9% New York 8.5%
|
|
London 94.8% Rio Tinto Australian 19.8%
Nyse Alternext 5.1% New York 14.4%
BAT
Carnival
|
London 49.5%
New York 50.5%
|
|
SABMiller
|
London 73.2%
Johannesburg 26.8%
|
|
Amsterdam 58.8%
Old Mutual
|
London 71.7%
Johannesburg 28.0%
|
|
London 67.5%
Anglo American Johannesburg 26.2%
Nasdaq 6.3%
London 65.6%
London 63.3%
Reed Elsevier Amsterdam 34.8%
New York 1.8%
BHP Billiton
|
London 43.4%
Australian 33.8%
Johannesburg 8.3%
New York 14.3%
|
|
G4S
London 82.7% Shire London 59.6%
Copenhagen 17.3% Nasdaq 40.4%
HSBC New York 11.3%
Hong Kong 30.3%
London 58.3%
GlaxoSmithKline
|
London 82.0%
New York 17.8%
|
|
London 31.1%
Unilever Amsterdam 62.0%
New York 6.9%
!Source: ThomsonReuters Datastream as of November
2008 see
* Percentages calculated with the 6-months average daily
volumes
The average volumes of English and French companies traded on
the Nyse represents respectively 10.62% and 15.46% of the total volumes; 73.52%
of cases complying with the volume part of the efficiency definition.
However, the findings given in the exhibit #33, provide a
general overview by countries but also allow a limited interpretation. For
these reasons, we have analyzed the precise distribution of results; keeping in
mind that an efficient foreign cross-listing implies volumes greater than 5% of
the total volumes.
#35: Volumes Distribution Hold by Secondary Foreign-Listings
Considering All Stock Exchanges Except U.K. and Australian Stock
Exchanges
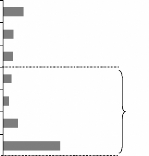
16.3%
8.4%
7.9%
6.5%
4.6%
67.5%
11.7%
44.7%
3.7%
5.0%
5.0%
6.6%
4.1%
86.3%
14.9%
60.6%
More than 20%
Between 10% - 20%
Between 5% -
10%
Between 2% - 5%
Between 1% - 2%
Between 0.1% - 1%
Below 0.1%
More th an 20%
Between 10% - 20%
Between 5% -
10%
Between 2% - 5%
Between 1% - 2%
Between 0.1% - 1%
Below 0.1%
Source: ThomsonReuters Datastream
As we noticed in the exhibit #33, foreign cross-listings
performed by British and Australian companies distinguish themselves from the
other ones. By eliminating these foreign cross-listing cases, we may have a
more precise overview of the situation in other countries (see exhibit #35).
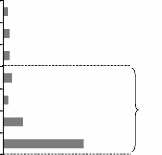
#36: Volumes Distribution:
Focus on the Basic Resources and
Mining Sectors
Volumes
As secondary Stock
Exchange
|
|
On the Primary Stock
Exchange
|
|
|
|
|
TSX & TSX Venture
L.S.E
|
38.0%
20.8%
|
62.0%
79.2%
|
ASX
|
32.8%
|
67.2%
|
|
Cases >5% of total volumes 78.26% i.e. 90
cases
Source: ThomsonReuters Datastream
The exhibit #36 is quite interesting, since it offers a
closer look at the foreign cross-listing phenomenon in the Basic Resources and
Mining sectors. The places of Toronto, London and Sydney had been chosen due to
their important influences on these two sectors.
As we may notice, these foreign cross-listings provide very
good volumes, with figures between 20.8% and 38.0% of the total distribution.
But above all, the most striking fact is the figure of 78.26%, corresponding to
the percentage of cases meeting the volume efficiency condition.
As regards the volume analysis, the findings lead to similar
conclusions to those stated in the previous liquidity part, that is to say the
majority of foreign cross- listings are inefficient. Indeed, it emerges that
only 32.5% of cases meet the volume efficiency condition, figures falling to
13.7% without taking into consideration U.K. and Australian companies.
Nevertheless, some specific cases may provide good results. These cases are
listed below:
4 Foreign cross-listings resulting from mergers operations
between companies originally listed in two different countries
4 A majority of foreign cross-listings in the United States
4 Foreign cross-listings in a financial place specialized in the
company's sector
| 

