IV.3.b. Current Tendency: the "Fading Listing"
According to a study of the Banque de France made at the end
of December 2007, 38.5% of the companies composing the French index CAC
4050 was owned by nonresidents investors. However, the trading
activity analysis of the same crop of companies highlights the predominant
share of 96.8%51 held by Euronext Paris, clearly demonstrating that
the very great majority of investors are used to buying and to selling their
shares on the company's main trading market.
Furthermore, a more detailed look at the evolution of volume
distribution in cases of efficient foreign cross-listings reinforces this
notion of investors' preference for the most liquid trading place.
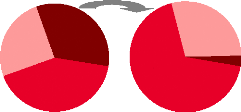
The following exhibits #38 illustrate this tendency applied
to bi-national companies, materialized by steadily diminishing volumes on the
secondary listing places during the years following the merger (see most
representative cases of ABB, AstraZeneca, InBev, SABMiller and Anglo
American).
By this way, after a certain period of time the most liquid
place overrides the other ones, leading to the marginalisation of the secondary
foreign cross-listings. Hence, an efficient foreign cross-listing in year T,
may become no longer efficient in year T+8 (e.g. see cases of Aventis, SAS,
AngloGold Ashanti and Altadis). In this research, this new notion will be
called the "Fading Listing". After a merger operation, the fading listing seems
to be verified whatever the company's origin country and the secondary stock
exchange. The average CAGR52 fading listing calculated thanks to the
examples presented in the exhibits #38 reaches -19.01%, suggesting that after a
merger operation the share in the total volumes held by the secondary listing
places losses on average -19.01% per year.
The case of the Anglo-South African SABMiller is probably the
most interesting case (see figures in exhibit #38). In 1999 the group SAB
(South African Breweries, and later renamed SABMiller after the purchase of the
U.S. based company Miller Brewing in 2002) initiated a listing on the L.S.E. At
this time, the share in volumes traded in London accounted for 32%, the rest
being traded in Johannesburg. Nine years later, the influence is reversed since
London henceforth accounts for 73% of the total volumes. During these years,
the overall greater liquidity of the British stock exchange had played the role
of catalyst by attracting
50 Are considered 36 companies belonging to the CAC
40, i.e. except those which have their head offices outside France like EADS,
ArcelorMittal, Dexia and STMicroelectronics
51
6-months average, source: ThomsonReuters Datastream
52 Compound Annual Growth Rate (CAGR), for more
details see Appendix 1
more and more investors. This example confirms the preference
of investors for the most liquid places.
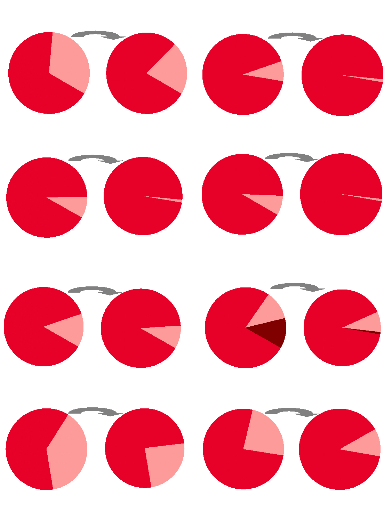
However, it is important to have a closer look at the foreign
cross-listings in the United States. Indeed the exhibit #37, clearly suggests
that a foreign cross-listing in the United States is generally not impacted by
the fading listing phenomenon. As we may notice, companies resulting from
merger operations with an American company naturally have a significant share
of their trading activity performed in New York; share which is even used to
gaining in weight over the years (GlaxoSmithKline 18% in 2008 vs. 12% in 2000),
Alcatel-Lucent (32% in 2008 vs. 24% in January 2007). But such levels may also
concern companies not resulting of a merger operation such as the German
companies SAP (24% in 2008 vs. 10% in 2000) and Infineon AG (17% in 2008 vs.
5.8% in 2004), the British Diageo (22% in 2008 vs. 8% in 2000). Therefore,
after a foreign cross-listing in the United States, we may state that the
American listing gains in importance in the company's total trading
activity.
#37: Evolutions of the Share in Total Volumes of Foreign
Cross-Listings
in New York (Period 2000-2008)
|
British
Companies
|
French
Companies
|
German
Companies
|
Japanese
Companies
|
New York
Examples
|
|
|
|
|
|
+44%
|
+37%
|
+373%
|
|
32%
Alcatel-Lucent
|
24%
SAP
|
25%
Nidec
|
% max of volumes traded in New York
Company
|
|
Source: ThomsonReuters Datastream
AstraZeneca
As of after the merger, i.e. 01/2000 As of 11/2008
TeliaSonera
As of after the merger, i.e. 01/2003 As of 11/2008
Source: ThomsonReuters Datastream
66
#38: Shares of Volume Evolutions
ABB
Aventis
As of 01/2000 As of 11/2008
As of after the merger, i.e. 01/1999 As of 1/2004
Nyse Euronext
Euronext
Brussels
0.04%
Amsterdam
0.03%
Brussels
0.1%
As of before the merger w ith Nyse,
i.e. 5/2007
As of after the creation of Euronext,
i.e. 08/2001
As of after the merger, i.e. 05/2007 As of 11/2008
Amsterdam
-89%
Paris
99%
Paris
8%
9%
Paris
91% Amsterdam
Amsterdam
1%
New York
92%
Paris
-88%
New York
99% Paris
1%
Stockholm
Frankfurt
-88%
-34%
Paris
92%
Zurich
79%
Frankfurt
1%
Zurich
68%
Stockholm
32%
Stockholm
21%
Frankfurt
8% Paris
99%
Unibail-Rodamco
As of after the merger, i.e. 11/2007 As of 11/2008
EADS
As of after the merger, i.e. 01/2001 As of 11/2008
Amsterdam
-31%
Frankfurt
12%
Paris
87%
Paris
90%
Paris
76%
Spain
12%
Amsterdam
13%
Paris
91% Amsterdam
9%
Frankfurt -25%
Madrid -92%
Frankfurt
9% Spain
1%
London
62%
Stockholm
38%
Stockholm
-37%
London
76%
Stockholm
24%
Stockholm
76%
Helsinki
24%
Helsinki
-54%
Stockholm
89%
Helsinki
11%
Fortis
As of after the merger, i.e. 01/1992 As of 11/2008

Amsterdam
90%
Brussels
10%
Amsterdam
-13%
Amsterdam
78%
Brussels
22%
As of 01/2002 As of 11/2008
Copenhagen
26%
Stockholm
41%
Oslo
33%
Oslo -91%
Oslo
Stockholm 3%
68%
Copenhagen
29%
Anglo American AngloGold Ashanti
As of after the merger, i.e. 01/1 999 As of 11/2008
As of after the merger, i.e. 06/2004 As of 11/2008
Altadis
As of after the merger, i.e. 05/2000 As of 2/2008
SABMiller
As of after the IPO on L.S.E, i.e. 12/1999 As of 11/2008
Royal Dutch Shell
InBev
Paris
0.89%
Paris
0.59%
Nasdaq
4%
Johannesburg
-38%
Sydney -75%
Paris -34%
London
68%
Sydney
2%
London
54%
Johannesburg
42%
Johannesburg
26%
Johannesburg
91% Sydney
8%
Johannesburg
97%
Nasdaq
6%
Paris -94%
London
73%
London
32%
Madrid
88% Paris
12%
Madrid
99% Paris
0.7%
Johannesburg
68%
Johannesburg
-60%
Johannesburg
27%
As of after the merger, i.e. 04/2004 As of 11/2008
As of after the merger, i.e. 07/2005 As of 11/2008
Brazil
48%
Brazil -48%
Brazil
25%
London
38%
London -13%
London
33%
New York
8%
New York
11%
Belgium
75%
Belgium
52%
Amsterdam
51%
Amsterdam
59%
Source: ThomsonReuters Datastream
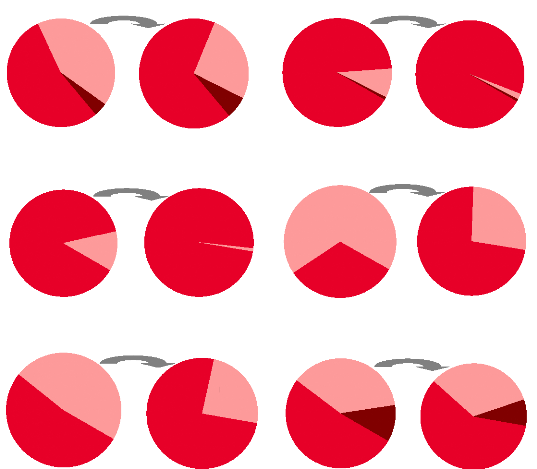
#39: Evolutions of the Share in Total Volumes of Foreign
Cross-Listings in
Financial Places Specialized in the Basic Resources and
Mining Sectors
(Period 2006-2008)
As Secondary Stock Share of Volume % of
Positive
Exchange Variation Variations *
|
|
|
|
|
|
|
|
|
TSX & TSX Venture L.S.E
|
|
|
+12.9%
+42.2%
|
|
|
|
38%
33%
|
|
ASX
|
|
|
+45.2%
|
|
|
|
57%
|
|
|
Source: ThomsonReuters Datastream
* Percentage of foreign cross-listing cases presenting an
increase of the weight of TSX, L.S.E or ASX in the total volumes
A first glance at the exhibit #39 would let suggest that
foreign cross-listings in specialized financial places are efficient thanks to
positive variations of the share in total volumes during the period 2006-2008.
The listing fading seems not to be verified for these cases of foreign
cross-listings, with shares in volume variation reaching +12.9% in Toronto,
+42.2% in London and +45.2% in Sydney.
However, this presumption has to be mitigated since the
tendency is not as clear as the one showed in the cases of foreign
cross-listings in the United States. Indeed, the findings are not totally
convincing, since the percentage of cases with positive variations is
relatively mixed for all three listing places, but above all a majority of
negative variations on the Toronto and the London stock exchanges. Only the
cases presenting negative shares of volumes variation suffer from the fading
listing phenomenon.
| 

