II. Geography of the Foreign Cross-Listing
II. 1. Methodology for the Creation of the Sample
II.1.a. Sources
Different sources had been used and cross-checked for the
creation of the sample, therefore allowing us to develop our foreign
cross-listing analysis.
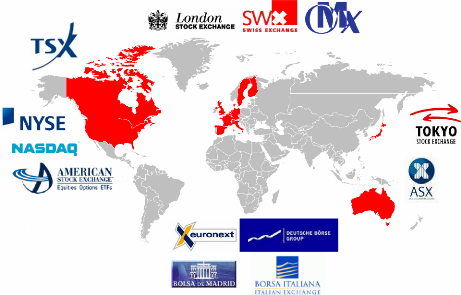
This analysis focus on 15 stock exchanges (4 North American,
11 Western European, 1 Japanese, 1 Australian) located in 15 developed
countries, and representing 85.31% of the world total trading value as of July
2008 YTD26, i.e. US$49,856,092 million27.
#13: Map of the Stock Exchanges Selected for the Analysis
26 YTD means Year-to-date, as of July 2008
27
Calculated with data from the World Federation of Exchanges
#14: Stock Exchanges Share of Worldwide Volumes July 2008 YTD
|
Share inTotal
|
Western
|
Share inTotal
|
|
Share inTotal
|
|
Americas
|
Trading Value
|
Europe
|
Trading Value
|
Asia-Oceania
|
Trading Value
|
|
|
|
|
|
|
|
Nyse
|
35.16%
|
L.S.E
|
7.81%
|
Tokyo SE
|
6.04%
|
|
Nasdaq
|
14.69%
|
Deutsche Bôrse
|
4.36%
|
ASX
|
1.49%
|
|
Nyse Alternext
|
0.66%
|
Euronext
|
5.10%
|
|
|
|
TSX
|
1.90%
|
Paris
|
|
|
|
|
|
Amsterdam
|
|
|
|
|
|
Brussels
|
|
|
|
|
|
SWX
|
1.76%
|
|
|
|
|
OMX
|
1.56%
|
|
|
|
|
Borsa Italiana
|
1.88%
|
|
|
|
|
BME
|
2.89%
|
|
|
Source: World Federation of Exchanges
In a first step, we used stock exchanges' websites in order to
get the complete lists of all foreign companies listed on each places.
4 Nyse (New York Stock Exchange)
4 Nasdaq
4 Nyse Alternext, former Amex (American Stock Exchange)
4 TSX and TSX Venture (Toronto Stock Exchange)
4 Euronext-Alternext Paris, Amsterdam, Brussels
4 L.S.E-AIM
4 Deutsche Biirse
4 SWX/VTX (Swiss Stock Exchange)
4 OMX Nordic Exchange (Stockholm, Copenhagen and Helsinki)
4 Borsa Italiana
4 BME (Bolsas y Mercados Espafioles)
4 ASX (Australian Stock Exchange)
4 TSE (Tokyo Stock Exchange)
After a precise analysis and cross-check with several tools
like Bloomberg and ThomsonReuters Datastream, we had arrived to a final sample
composed of 1,347 foreign cross-listing cases.
However it is important to notice that the figure 1,347
includes cases where a company owns multiple foreign cross-listings. The
company ArcelorMittal is one of these cases with listings on Euronext Paris,
Euronext Brussels, Euronext Amsterdam, Bourse du Luxembourg, BME Madrid and on
the Nyse.
Afterwards, as regards of the analysis of data such as the
performances, the volumes, the sales or the net incomes, the sample had been
reduced to companies providing daily trading information with tools like
Bloomberg and ThomsonReuters Datastream.
II.1.b. Statements and Assumptions Regarding the
Analysis
In this analysis,
4 If a company is listed on different stock exchanges belonging
to the same country, e.g. Nyse/Nasdaq or Frankfurt/Xetra, we had only
considered it once.
4 If a company owns on the same stock exchange different
kinds of financial instruments (e.g. class A and class B shares, different
kinds of ADR, shares and ADR), we had only considered it once. For instance,
this was the case of the Japanese companies Torray Industries and Fujitsu
listed on the L.S.E.
4 In the sample, we consider DLCs (Dual-Listed Companies).
4 As regards listings in Germany (Frankfurt and XETRA), the
quasi totality of listed companies in the world are proposed to the trading by
the operator Deutsche Biirse, i.e. a total of 11,355 German and foreign
companies. However, in this research we had only considered companies having
initiated by themselves foreign cross-listings in Germany.
The following cases had been excluded from the sample,
4 ETF (Exchange-Traded Funds) or index trackers, e.g. Lyxor
ETFs, iShares, PowerShares, and so on
4 Companies which are not listed in their (or at least one of
their) incorporation country(ies)
4 OTC (Over-the-Counter) traded shares
4 Non-sponsored Depositary Receipts (DRs)
Stock Exchange
TSX 34 2173 12 1 2
SWX 60 4 16 2 12 20 6 251 7 1 7 135 6
141 392 36,0%
OMX 3 3 1 676 7 0 7 682
1,0%
BME 1 1 1 1 151 1 5 29 34 192
17,7%
Borsa Italiana 1 6 17 12 1 1 3 286 41 1
42 328 12,8%
Tokyo SE 8 1 1 3 2 1 1 1 2271 18 2
20 2295 0,9%
ASX 8 10 2024 18 15 33 2056
1,6%
Nyse 2869
Nasdaq 2895
Nyse Alternext Amex) 759
Euronext Amsterdam 2 2 142 4 7 2 9 1 2 29
6 35 196 17,9%
Euronext Brussels 4 187 6 1 11 8
19 237 8,0%
Euronext Paris 15 8
Deutsche Börse 3 1 2 1 5 1307 3 2 1 2 2 1
23 7 30 1336 2,2%
L.S.E 31
Origin
Sc
U.S Canada NL Belgium France Germany U.K Swiss Spain
Italy Japan Australia
andinavia
36
42
76
62
4 3 3 5 1 3 7 10 72 61 133 3200 4,2%
6 1 9 9 26 5 4 5 5 19 5 170 148 318 3620
8,8%
7 3 9 1810 5 4 17
9
673 3 11 1 0 2 1 50 15 65 756 8,6%
2 1 65 2 67 862 7,8%
36
26
Total from
MEDC
Countries
154 156 310 2333 13,3%
75 18 93 2369 3,9%
Total from
Emerging
Countries
Total
Cross-
Listings
# of local
companie
s listed
% of foreign cross- listings
3,5%
2,4% 3,9%
10 55 79 873 474 1347
1,1% 6,3% 9,0% 100%
11.2. Presentation of the Results

Total Listings
|
166
|
224
|
55
|
17
|
66
|
61
|
89
|
11
|
25
|
15
|
Degree of cross-listing
|
2,6%
|
10,3%
|
38,7%
|
9,1%
|
9,8%
|
4,7%
|
4,9%
|
4,4%
|
3,7%
|
9,9%
|
Weight / total
|
19,0%
|
25,7%
|
6,3%
|
1,9%
|
7,6%
|
7,0%
|
10,2%
|
1,3%
|
2,9%
|
1,7%
|
|
#15: Geographic Distribution of Foreign Cross-Listings from the
MEDC Countries28
#16: Geographic Distribution of Foreign Cross-Listings from
non-MEDC Countries

Origin
Stock Exchange
Nyse Nasdaq
Nyse Alternext (Amex)
TSX
Euronext Amsterdam Euronext Brussels
Euronext Paris
Deutsche Börse
L.S.E SWX OMX BME Borsa Italiana
Tokyo SE
ASX
Total Listings
Lux.
Greece
|
Ireland
|
Austria
|
Lichtens
Portugal
tein
|
Russia
|
Turkey
|
Eastern
Europe
|
China
|
India
|
South
Korea
|
Taiwan
|
Pakistan
|
Indonesi
a
|
Singap.
|
New
Zealand
|
Africa /
Middle
East
|
Israel
|
South
Am.
|
1
|
3
|
4
|
|
1
|
|
5
|
1
|
1
|
20
|
10
|
8
|
5
|
|
2
|
|
1
|
6
|
3
|
77
|
1
|
|
3
|
|
|
|
|
|
|
|
1
|
1
|
1
|
|
|
1
|
|
5
|
42
|
6
|
|
|
|
|
|
|
|
|
|
1
|
|
|
|
|
|
|
|
|
1
|
|
|
|
|
|
|
|
|
|
|
4
|
|
|
|
|
|
|
2
|
9
|
|
3
|
4
|
|
|
|
|
|
|
|
|
|
2
|
|
|
|
|
|
|
|
|
|
4
|
|
|
|
|
|
|
|
|
|
|
|
|
|
|
|
|
1
|
3
|
|
5
|
|
|
|
|
|
|
|
|
|
|
|
|
|
|
|
|
9
|
|
1
|
|
|
4
|
|
|
|
3
|
|
|
|
|
|
|
|
|
|
|
|
|
|
2
|
5
|
1
|
|
1
|
|
24
|
9
|
12
|
7
|
22
|
13
|
9
|
3
|
1
|
1
|
|
42
|
4
|
|
1
|
|
|
1
|
|
2
|
|
|
|
|
|
|
|
|
|
|
|
2
|
|
|
|
|
|
|
|
|
|
|
|
|
|
|
|
|
|
|
|
|
|
29
|
1
|
|
|
|
|
|
|
|
|
|
|
|
|
|
|
|
|
|
|
|
|
|
|
|
|
|
|
|
|
|
|
1
|
|
|
1
|
|
|
|
|
|
|
|
|
|
|
|
|
|
|
|
|
|
|
|
|
1
|
12
|
2
|
|
|
19
|
8
|
12
|
1
|
2
|
2
|
32
|
10
|
13
|
32
|
35
|
23
|
15
|
3
|
4
|
3
|
15
|
76
|
53
|
116
|
|
| 

