II.3. Empirical Interpretation of the Results
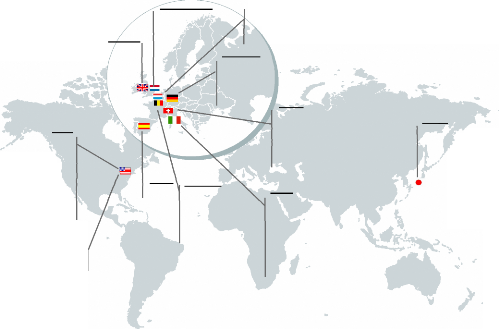
II.3.a. Geographic Distribution
This study focuses on companies which are foreign
cross-listed on the main world financial places located in 15 countries: the
United States, Canada, Australia, Japan, The United Kingdom, France, Germany,
the Netherlands, Belgium, Switzerland, Northern Europe (Sweden, Finland and
Denmark), Italy and Spain.
This analysis records a total of 1,347 foreign cross-listing
cases. Among these 1,347 foreign cross-listings, 873 (64.8%) come from the main
MEDC28 countries, whereas the rest comes from Eastern Europe,
Russia, Turkey, China, India, Taiwan, South Korea, Pakistan, Indonesia,
Singapore, New Zealand, Israel, South America and Africa.
As we could anticipate, the most attractive places are the
American stock exchanges (Nyse, Nyse Alternext and Nasdaq), the L.S.E and to a
lesser extent the Swiss Stock Exchange, with respectively 518, 310 and 141
cross-listings of foreign companies. This supremacy is probably linked to the
strong degree of internationalisation of these stock exchanges (see following
exhibit #17), the predominant influence of three of the strongest currency in
the world (US Dollar, British Pound and Swiss Franc), but also the weight in
the world financial system of Wall Street, the City and the Swiss banking
industry.
#17: Weight of Foreign Companies on Each Main Stock
Exchange29
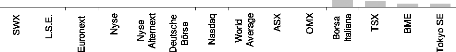
21.7%
19.6% 18.2% 17.6%
12.1% 11.5%
7.0%
4.1% 3.1% 2.0% 1.8% 1.1% 1.0%
24.4%
Source: World Federation of Exchanges
28 More Economically Developed Countries (Germany,
France, U.K, Switzerland, Italy, Spain, Netherlands, Belgium, Scandinavia,
Canada, the United States, Japan and Australia)
29 Excluding investment funds and Calculated in terms
of number of companies
The exhibit #18 provides a global overview of the interest in
foreign cross-listin by local companies.
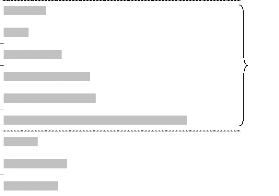
#18: Number of National Companies Cross-Listed Abroad
Total Cross-
Listings Abroad
Degree of
cross-listing 43
Total Cross-
Listings Abroad
Degree of
cross-listing 43
|
U.S
|
Canada
|
France
|
Japan
|
Australia
|
|
Worldwide
|
Spain
|
Italy
|
|
224
|
|
79
3.9%
Belgium
|
Swiss
|
873
4.7%
Scandinavia
|
|
10.3%
|
|
U.K
|
|
89
4.9%
|
66
|
55
|
17
|
11
4.4%
|
25
|
15
|
10
3.5%
|
|
38.7%
|
9.1%
|
|
9.9%
|
|
The Canada and the United States present both the greater
number of cross- listings abroad, with respectively 224 and 166 cases, that is
to say 25.7% and 19.0% of the total sample. However, after a more precise
analysis of the degree of cross-listings31, it appears that Canadian
companies are much more favorable for foreign cross-listings, since 10.3% of
companies listed on the TSX and TSX Venture have another listing abroad vs.
only 2.6% for American ones. In the past, Canadian companies have been
historically cross-listed in the United States, whereas the reverse is not
completely true: 77.7% of Canadian foreign cross- listings are performed in the
United States vs. only 20.5% for American companies in Canada. Worldwide, the
degree of cross-listing represents 4.7% of all national listings.
According to the results, it emerges that companies from the
Euro Zone32 are the most eager to perform foreign cross-listings
(Euro Zone average at 8.2%), even if result are relatively disparate (from 3.5%
up to 38.7%). The other countries reach a maximum of 4.9% (one notable
exception, Canada which is at the same level as France and Spain, i.e. circa
10%). Moreover, the Euro Zone companies appear more likely to perform a second
listing inside the Euro Zone (77.2% of cases),
30 Number of cross-listings performed by national
companies / Number of national companies listed
31 # of cross-listings abroad performed by national companies /
Total # of national companies listed on the national stock exchange
32 The Netherlands, France, Spain, Belgium, Germany
and Italy
whereas at the European Union scale the figure decreases to
64.2%. This result is not surprising since we may point up the beginning of a
unified European market materialized by a unique currency, a common top
authority (the European Commission) and the total abolition of borders.
#19: Distribution of French Cross-listed Companies
Peugeot Saint Gobain
Frankfurt
Eurotunnel
EADS Lagardère Sanofi
Saint Gobain Total
Tokyo
Alcatel-Lucent
Nyse
BNP Paribas
*****
Societe Generale *
***
Swiss
Alcatel-Lucent GDF Suez
Axa Sanofi
BNP Paribas Scor
Danone Saint Gobain
France Telecom Total
LVMH Vivendi
Spain
Brussels
~ ~~ ~ ~ ~
Milan
EADS

Alcatel-Lucent
Axa
CGG Veritas
France
Telecom
Sanofi (ADR)
STMicroelectronics
Total
Thomson
Veolia
(ADR)
Alcatel-Lucent
GDF Suez Peugeot
Saint Gobain
Total Vranken-Pommery
Nasdaq
* Dassault Systemes
** Ilog
*** Wavecom
Alcatel-Lucent LVMH
AXA PPR
BNP Paribas Renault
Carrefour Sanofi
Crédit Agricole Societe Generale Danone
STMicroelectronics
France Telecom Vivendi
GDF suez Total
L'Oréal
Amsterdam
Alcatel-Lucent Saint Gobain
Air France-KLM STMicroelectronics EADS
Unibail-Rodamco
Gemalto
Luxembourg GDF Suez
London
Sources: Companies
* The delisting of Dassault Systemes from the Nasdaq in 2008
is in progress
** In 2008,the American IBM launched a takeover on
Ilog
*** In December 2008, the Canadian Sierra Wireless launched
a takeover on Wavecom
**** Societe Generale has announced its delisting from Tokyo
for the end of 2008 ***** BNP Paribas has announced its delisting from Tokyo
during the year 2009
II.3.b. Sector
A closer look at the exhibits #15 and #16 highlights the
correlation between the foreign cross-listings and the dynamism of cross-border
mergers/acquisitions at the European scale (e.g. connections between
France/Italia, France/Netherlands, U.K./Netherlands and
Germany/Switzerland).
As noticed in part I.3.c Financial Motivations, the findings
also verify the attractiveness of specialized financial places for some
sectors. The case of the Toronto Stock Exchange (TSX) is particularly eloquent
(see exhibit #20); among all the foreign cross-listings on the TSX, 87% are
performed by companies operating in the Mining or Oil & Gas sectors. The
analysis of the typical Canadian company listed on the TSX shows that more
Mining and Oil & Gas companies are listed on the TSX than on any other
financial place in the world (Mining and Oil & Gas represent 402 of the 612
Canadian companies listed on the TSX). This result is the consequence of the
major influences of these sectors within the Canadian economy.
#20: Weight of Companies Operating in
he Mining and Oit
& Gas sectors in the TSX
|
Canadian
Companies
on the TSX
|
Foreign
Cross-Listings
on the TSX
|
Mining
|
267
|
87
|
Oil & Gas
|
135
|
12
|
Sum
|
402
|
99
|
% of all Canadian companies on the TSX
|
66%
|
|
|
% of cross-listed companies on the TSX
|
|
87%
|
|
|
This tendency may also be verified with the
technology-IT-biotech companies foreign cross-listed on the Nasdaq, with 77% of
Australian cross-listed companies operating in the Pharmaceutical or
Biotechnology sector.
Another example: among the 41 Israeli cross-listed companies
on the Nasdaq, 40 are operating in the Pharmaceutical, Biotech or IT sectors.
In comparison, there are only 3 Israeli foreign cross-listings on the Nyse and
4 on the L.S.E.
Moreover, we may notice that a major player within a sector
has an influence on the foreign cross-listings of its peers by attracting them
in its primary listing place. The rationale for such operation is the
following: when a financial place and its local investors are familiar with a
sector thanks to the presence of a local important player, it may be natural
for competitors to approach these same investors and therefore to raise
capital.
For instance, the analysis of British companies foreign
cross-listed on Euronext Paris shows that these companies own an important
subsidiary operating in the French market or have a French important
competitor. Among the 11 British companies cross-listed on Euronext Paris
4 HSBC owns the former French bank CCF since 2005
4 Kesa owns Darty, the second largest business unit of the group
(after Comet)
4 Kingfisher owns Castorama, the second largest French retailer
of home improvement tools and supply
4 Diageo is the main competitor of Pernod-Ricard, the world's
second largest player in the beverage sector
4 BP is one of the main competitors of the French major Total
4 Hammerson and Segro are competitors of world biggest real
estate company, the French-Dutch Unibail-Rodamco
As regards the 42 foreign companies cross-listed in Italy
4 AXA, Allianz, Aegon, Fortis, ING are competitors of the
3rd European insurer, Generali
4 Total is one of the main European competitors of the major
Eni
4 BNP Paribas and Credit Agricole are foreign cross-listed in
Italy since their important acquisition of Italian banks, respectively BNL
and
Ca riparma/FruilAdria
4 LVMH and PPR made important Italian acquisitions such as
Fendi, Gucci, Bottega Veneta
II.3.c. Size and Growth
As anticipated in part 111.1. Decreasing Advantages and
Increasing Concerns ?, a focus on companies' size shows that foreign
cross-listings are in the very great majority performed by large companies,
with 76.4% of the sample presenting a market capitalisation greater than US$1bn
(as of October 2008). The main reason behind this tendency is the cost related
to a foreign listing which is a financial border between small and large
companies.
According to the results, foreign cross-listed companies present
on average sales of US$31.2bn and a market capitalisation of US$26.8bn.
#21: Average Sales and Market Capitalisation of
Companies
Composing the Sample
Total Sales
(mUS$)
|
|
Market Cap.
(mUS$)
|
|
|
|
|
Average 31238 26793
Median 9640 8274
Source: ThomsonReuters Datastream
#22: Breakdown of the Sample by Market Capitalisation
5.3%
9.9%
8.5%
6.6%
3.9%
9.1%
13.5%
14.4%
28.8%
76.4%
More than $100bn
Between $75bn - $100bn
Between $50bn -
$75bn
Between $20bn - $50bn
Between $10bn - $20bn
Between $1bn -
$10bn
Between $500m - $1 bn
Between $100m - $500m
below $100m
Source: ThomsonReuters Datastream
#23: Average Sales and Market Capitalisations by Stock
Exchange (in mUS$)
Sales Mkt Cap Sales Mkt Cap Sales Mkt Cap
28522 27819 6516 3263 194 420
Milan
|
Swiss
|
Frankfurt
|
Paris
|
|
Sales Mkt Cap Sales Mkt Cap Sales Mkt Cap Sales Mkt Cap
63801 54269 57650 45209 44832 52508 42048
39410
Sales Mkt Cap Sales Mkt Cap Sales Mkt Cap
25928 18203 22425 19514 16992 22125
Sales Mkt Cap Sales Mkt Cap
58493 63088 3618 4157
Source:
ThomsonReuters Datastream
After a more detailed look at the data, it emerges major
differences of company profile between stock exchanges.
First of all, the analysis of the average size brings to
light that places like Paris, Frankfurt, Milan, Zurich or Tokyo mainly attract
very large multinationals (i.e. most of these companies belong to their
national reference index), whereas London and New York have a broader scope by
attracting more medium-sized companies as well as emerging countries companies.
This point is reinforced by the analysis of the dot distribution in the four
point clouds in exhibits #24.
Furthermore, it is worth to notice the major difference of
size and sales between the two main American stock exchanges, since foreign
cross-listed companies on the Nasdaq are on average far away smaller than those
on the Nyse. This may be explained by the different roles played by each stock
exchange: the Nyse is mainly targeted by multinational companies, well
established and operating in traditional activities, whereas the Nasdaq
welcomes more fast growing companies (see exhibit #25).
#24: Correlation between Net Incomes 2007 and Market
Capitalisations (mUS$)
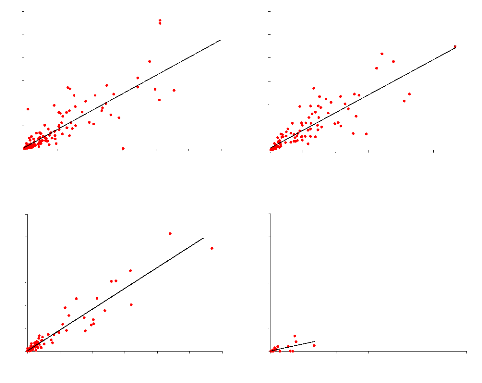
Net Incomes 07 Net Incomes 07
R2 = 0.7612
Market Cap.
0 50000 100000 150000 200000 250000 300000
Nyse
Net Incomes 07
0 50000 100000 150000 200000 250000 300000
Europe*
Net Incomes 07
0 50000 100000 150000 200000 250000 300000
L.S.E
0 50000 100000 150000 200000 250000 300000
Nasdaq
30000
25000
30000
R2 = 0.7475
Market Cap.
25000
20000
15000
10000
5000
0
R2 = 0.9052
Market Cap.
30000
25000
20000
15000
10000
5000
0
30000
25000
20000
15000
10000
R2 = 0.464
Market Cap.
5000
0
20000
15000
10000
5000
0
Source: ThomsonReuters Datastream R2 is the
correlation in linear regression
Most striking, is the strong correlation between the net
incomes 2007 and market capitalisations for companies foreign cross-listed on
the L.S.E, on the Nyse and in Europe, with respectively R2 of 0.91,
0.76 and 0.75. A contrario, foreign crosslisted companies on the Nasdaq
generally offer a weak correlation with R2 dropping to 0.46. This
confirms the presence on the latter of smaller and fast-growing companies.
However, there is no proven correlation between the Price
Earnings Ratio (P/E) and the sales growth CAGR (Compound Annual Growth Rate)
for the period 2004- 2007 (see appendix 1).
* Europe includes main European markets for Foreign
cross-listing, i.e. France, Germany, Switzerland and Italy
#25: Sales Growth CAGR during the period 2004-2007
Euro Zone U.K Canada U.S
Origin Place
Foreign Listing Place
Japan Emerging
Countries

|
|
|
Average
|
|
|
Nyse
|
+9.3%
|
+6.3%
|
+24.4%
|
-
|
+10.5%
|
+30.8%
|
Nasdaq
|
+19.7%
|
+10.8%
|
+33.9%
|
|
-+1.9%
|
+14.6%
|
L.S.E
|
+10.9%
|
-
|
+38.7%
|
+7.1%
|
+7.1%
|
+17.7%
|
Euronext Paris
|
+4.6%
|
+9.1%
|
n.a
|
+8.3%
|
n.a
|
+33.0%
|
|
n.a: no enough data available Source: ThomsonReuters
Datastream
Note:
As regards Canadian foreign cross-listed companies, the
figures mostly concerns companies operating in the sector of Mining and Oil
& Gas; that explains the impressive double digit sales growth over the last
few years.
| 

