ANNEXES
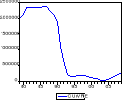
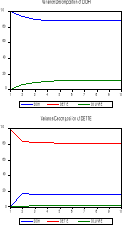
GRAPHIQUE 1 : EVOLUTION DE LA PRODUCTION DU CUIVRE
EN DOLLARS
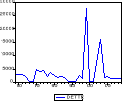
GRAPHIQUE 2 : EVOLUTION DE LA DETTE
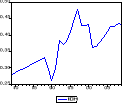
GRAPHIQUE 3 : EVOLUTION DE L' IDH
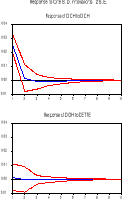
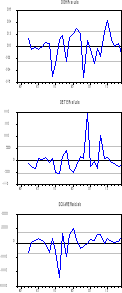
GRAPHIQUE 5 : ANALYSE DES CHOCS
GRAPHIQUE 5 : DECOMPOSITION DE LA VARIANCE DE
L'ERREUR PREVISIONNELLE
GRAPHIQUE6 : DES RESIDUS PREVISIONNELS
CORRELOGRAME 1 : SERIE DU CUIVRE
|
Date: 10/15/10 Time: 10:23
|
|
Sample: 1979 2009
|
|
Included observations: 31
|
|
Autocorrelation
|
Partial Correlation
|
|
AC
|
PAC
|
Q-Stat
|
Prob
|
|
. |*******|
|
. |*******|
|
1
|
0.956
|
0.956
|
31.193
|
0.000
|
|
. |*******|
|
***| . |
|
2
|
0.881
|
-0.400
|
58.553
|
0.000
|
|
. |****** |
|
.**| . |
|
3
|
0.779
|
-0.251
|
80.709
|
0.000
|
|
. |***** |
|
. | . |
|
4
|
0.666
|
-0.034
|
97.515
|
0.000
|
|
. |**** |
|
. | . |
|
5
|
0.549
|
-0.039
|
109.36
|
0.000
|
|
. |*** |
|
. *| . |
|
6
|
0.429
|
-0.090
|
116.90
|
0.000
|
|
. |**. |
|
. *| . |
|
7
|
0.309
|
-0.092
|
120.98
|
0.000
|
|
. |* . |
|
. *| . |
|
8
|
0.190
|
-0.067
|
122.59
|
0.000
|
|
. |* . |
|
. *| . |
|
9
|
0.073
|
-0.103
|
122.84
|
0.000
|
|
. | . |
|
. | . |
|
10
|
-0.038
|
-0.035
|
122.91
|
0.000
|
|
. *| . |
|
. *| . |
|
11
|
-0.143
|
-0.067
|
123.95
|
0.000
|
|
.**| . |
|
. | . |
|
12
|
-0.234
|
-0.001
|
126.90
|
0.000
|
|
.**| . |
|
. |**. |
|
13
|
-0.297
|
0.212
|
131.90
|
0.000
|
|
***| . |
|
. *| . |
|
14
|
-0.342
|
-0.088
|
138.92
|
0.000
|
|
***| . |
|
. *| . |
|
15
|
-0.370
|
-0.080
|
147.69
|
0.000
|
|
***| . |
|
. *| . |
|
16
|
-0.395
|
-0.142
|
158.32
|
0.000
|
CORRELOGRAMME 2 : SERIE DETTE
|
Date: 10/15/10 Time: 10:28
|
|
Sample: 1979 2009
|
|
Included observations: 31
|
|
Autocorrelation
|
Partial Correlation
|
|
AC
|
PAC
|
Q-Stat
|
Prob
|
|
. | . |
|
. | . |
|
1
|
-0.042
|
-0.042
|
0.0593
|
0.808
|
|
. *| . |
|
. *| . |
|
2
|
-0.143
|
-0.145
|
0.7762
|
0.678
|
|
. | . |
|
. | . |
|
3
|
-0.003
|
-0.016
|
0.7765
|
0.855
|
|
. |**. |
|
. |**. |
|
4
|
0.269
|
0.253
|
3.5211
|
0.475
|
|
. *| . |
|
. *| . |
|
5
|
-0.147
|
-0.136
|
4.3705
|
0.497
|
|
. *| . |
|
. | . |
|
6
|
-0.096
|
-0.043
|
4.7488
|
0.576
|
|
. *| . |
|
. *| . |
|
7
|
-0.107
|
-0.155
|
5.2375
|
0.631
|
|
. *| . |
|
.**| . |
|
8
|
-0.122
|
-0.241
|
5.8944
|
0.659
|
|
. *| . |
|
. *| . |
|
9
|
-0.088
|
-0.073
|
6.2506
|
0.715
|
|
. | . |
|
. *| . |
|
10
|
-0.033
|
-0.084
|
6.3047
|
0.789
|
|
. | . |
|
. | . |
|
11
|
-0.014
|
0.006
|
6.3142
|
0.852
|
|
. | . |
|
. |* . |
|
12
|
0.057
|
0.115
|
6.4901
|
0.889
|
|
. | . |
|
. | . |
|
13
|
0.061
|
0.051
|
6.7032
|
0.917
|
|
. |* . |
|
. |* . |
|
14
|
0.078
|
0.085
|
7.0662
|
0.932
|
|
. *| . |
|
. *| . |
|
15
|
-0.079
|
-0.155
|
7.4624
|
0.944
|
|
. | . |
|
.**| . |
|
16
|
-0.043
|
-0.194
|
7.5891
|
0.960
|
CORRELOGRAMME 3 : SERIE IDH
|
Date: 10/15/10 Time: 10:33
|
|
Sample: 1979 2009
|
|
Included observations: 31
|
|
Autocorrelation
|
Partial Correlation
|
|
AC
|
PAC
|
Q-Stat
|
Prob
|
|
. |*******|
|
. |*******|
|
1
|
0.845
|
0.845
|
24.376
|
0.000
|
|
. |***** |
|
. *| . |
|
2
|
0.665
|
-0.175
|
39.973
|
0.000
|
|
. |**** |
|
. |* . |
|
3
|
0.540
|
0.097
|
50.608
|
0.000
|
|
. |*** |
|
. *| . |
|
4
|
0.406
|
-0.148
|
56.863
|
0.000
|
|
. |**. |
|
. | . |
|
5
|
0.278
|
-0.035
|
59.902
|
0.000
|
|
. |* . |
|
. | . |
|
6
|
0.171
|
-0.045
|
61.103
|
0.000
|
|
. |* . |
|
. |* . |
|
7
|
0.140
|
0.187
|
61.939
|
0.000
|
|
. |* . |
|
. |* . |
|
8
|
0.163
|
0.113
|
63.127
|
0.000
|
|
. |* . |
|
. | . |
|
9
|
0.164
|
-0.052
|
64.380
|
0.000
|
|
. |* . |
|
. *| . |
|
10
|
0.143
|
-0.061
|
65.378
|
0.000
|
|
. |* . |
|
. *| . |
|
11
|
0.103
|
-0.122
|
65.921
|
0.000
|
|
. | . |
|
.**| . |
|
12
|
-0.008
|
-0.296
|
65.925
|
0.000
|
|
. *| . |
|
.**| . |
|
13
|
-0.166
|
-0.216
|
67.487
|
0.000
|
|
.**| . |
|
. |* . |
|
14
|
-0.253
|
0.168
|
71.331
|
0.000
|
|
***| . |
|
. *| . |
|
15
|
-0.336
|
-0.144
|
78.566
|
0.000
|
|
***| . |
|
. |* . |
|
16
|
-0.390
|
0.096
|
88.952
|
0.000
|
TABLEAU 1 : CUIVRE
|
ADF Test Statistic
|
-0.682471
|
1% Critical Value*
|
-4.2949
|
|
|
5% Critical Value
|
-3.5670
|
|
|
10% Critical Value
|
-3.2169
|
|
*MacKinnon critical values for rejection of hypothesis of a unit
root.
|
|
|
|
|
|
|
|
|
|
|
|
Augmented Dickey-Fuller Test Equation
|
|
Dependent Variable: D(CUIVRE)
|
|
Method: Least Squares
|
|
Date: 10/15/10 Time: 10:37
|
|
Sample(adjusted): 1980 2009
|
|
Included observations: 30 after adjusting endpoints
|
|
Variable
|
Coefficient
|
Std. Error
|
t-Statistic
|
Prob.
|
|
CUIVRE(-1)
|
-0.052493
|
0.076916
|
-0.682471
|
0.5008
|
|
C
|
51038.72
|
214818.1
|
0.237590
|
0.8140
|
|
@TREND(1979)
|
-3526.916
|
8946.506
|
-0.394223
|
0.6965
|
|
R-squared
|
0.024244
|
Mean dependent var
|
-57506.67
|
|
Adjusted R-squared
|
-0.048034
|
S.D. dependent var
|
192341.1
|
|
S.E. of regression
|
196906.5
|
Akaike info criterion
|
27.31348
|
|
Sum squared resid
|
1.05E+12
|
Schwarz criterion
|
27.45360
|
|
Log likelihood
|
-406.7023
|
F-statistic
|
0.335425
|
|
Durbin-Watson stat
|
0.621458
|
Prob(F-statistic)
|
0.717972
|
TABLEAU 2 : DETTE
|
ADF Test Statistic
|
-5.506554
|
1% Critical Value*
|
-3.6661
|
|
|
5% Critical Value
|
-2.9627
|
|
|
10% Critical Value
|
-2.6200
|
|
*MacKinnon critical values for rejection of hypothesis of a unit
root.
|
TABLEAU 3 : SERIE IDH
|
ADF Test Statistic
|
-2.080105
|
1% Critical Value*
|
-4.2949
|
|
|
5% Critical Value
|
-3.5670
|
|
|
10% Critical Value
|
-3.2169
|
|
*MacKinnon critical values for rejection of hypothesis of a unit
root.
|
|
|
|
|
|
|
|
|
|
|
|
Augmented Dickey-Fuller Test Equation
|
|
Dependent Variable: D(IDH)
|
|
Method: Least Squares
|
|
Date: 10/15/10 Time: 10:53
|
|
Sample(adjusted): 1980 2009
|
|
Included observations: 30 after adjusting endpoints
|
|
Variable
|
Coefficient
|
Std. Error
|
t-Statistic
|
Prob.
|
|
IDH(-1)
|
-0.278826
|
0.134044
|
-2.080105
|
0.0471
|
|
C
|
0.084188
|
0.038193
|
2.204267
|
0.0362
|
|
@TREND(1979)
|
0.001420
|
0.000938
|
1.513128
|
0.1419
|
|
R-squared
|
0.139973
|
Mean dependent var
|
0.005227
|
|
Adjusted R-squared
|
0.076267
|
S.D. dependent var
|
0.027641
|
|
S.E. of regression
|
0.026566
|
Akaike info criterion
|
-4.323757
|
|
Sum squared resid
|
0.019055
|
Schwarz criterion
|
-4.183637
|
|
Log likelihood
|
67.85636
|
F-statistic
|
2.197180
|
|
Durbin-Watson stat
|
1.547027
|
Prob(F-statistic)
|
0.130591
|
TABLEAU 4 ; SERIE CUIVRE
|
ADF Test Statistic
|
-6.146654
|
1% Critical Value*
|
-4.3226
|
|
|
5% Critical Value
|
-3.5796
|
|
|
10% Critical Value
|
-3.2239
|
|
*MacKinnon critical values for rejection of hypothesis of a unit
root.
|
TABLEAU 5 : STATIONNARITE DE LA SERIE
IDH
|
ADF Test Statistic
|
-4.474891
|
1% Critical Value*
|
-4.3082
|
|
|
5% Critical Value
|
-3.5731
|
|
|
10% Critical Value
|
-3.2203
|
|
*MacKinnon critical values for rejection of hypothesis of a unit
root.
|
Tableau 6. Estimation du modèle VAR(1,1)
|
Date: 10/15/10 Time: 12:30
|
|
Sample(adjusted): 1981 2009
|
|
Included observations: 29 after adjusting endpoints
|
|
Standard errors & t-statistics in parentheses
|
|
DIDH
|
DCUIVRE
|
DETTE
|
|
DIDH(-1)
|
0.052561
|
1005615.
|
-83662.41
|
|
(0.19207)
|
(1021074)
|
(36533.9)
|
|
(0.27366)
|
(0.98486)
|
(-2.28999)
|
|
|
|
|
|
DCUIVRE(-1)
|
-4.94E-08
|
0.699617
|
0.000266
|
|
(2.8E-08)
|
(0.14781)
|
(0.00529)
|
|
(-1.77634)
|
(4.73326)
|
(0.05027)
|
|
|
|
|
|
DETTE(-1)
|
2.69E-08
|
0.406143
|
-0.048600
|
|
(9.5E-07)
|
(5.06634)
|
(0.18127)
|
|
(0.02827)
|
(0.08016)
|
(-0.26810)
|
|
|
|
|
|
C
|
0.001641
|
-27573.35
|
4091.402
|
|
(0.00645)
|
(34280.0)
|
(1226.54)
|
|
(0.25444)
|
(-0.80436)
|
(3.33574)
|
|
Determinant Residual Covariance
|
3.01E+14
|
|
|
Log Likelihood
|
-606.8313
|
|
|
Akaike Information Criteria
|
42.67802
|
|
|
Schwarz Criteria
|
43.24380
|
|
Tableau 7 : Analyse des chocs
|
Period
|
DETTE
|
DIDH
|
|
1
|
4901.725
|
279.2832
|
|
(643.628)
|
(910.966)
|
|
2
|
-236.4509
|
-2173.623
|
|
(824.766)
|
(920.926)
|
|
3
|
29.78183
|
-11.61203
|
|
(392.829)
|
(560.475)
|
|
4
|
28.62825
|
104.6562
|
|
(128.990)
|
(233.225)
|
|
5
|
18.81595
|
76.29011
|
|
(84.2630)
|
(125.963)
|
|
6
|
11.72090
|
48.24194
|
|
(53.1086)
|
(83.1863)
|
|
7
|
7.240581
|
29.87393
|
|
(33.5101)
|
(51.9748)
|
|
8
|
4.466733
|
18.43668
|
|
(21.2223)
|
(32.5839)
|
|
9
|
2.754916
|
11.37181
|
|
(13.4758)
|
(20.8656)
|
|
10
|
1.699066
|
7.013527
|
|
(8.57343)
|
(13.6356)
|
|
Ordering: DIDH DETTE DCUIVRE
|
|
Period
|
DIDH
|
DETTE
|
|
1
|
0.025811
|
0.000000
|
|
(0.00339)
|
(0.00000)
|
|
2
|
0.001479
|
-0.000197
|
|
(0.00477)
|
(0.00451)
|
|
3
|
-0.001188
|
-0.000346
|
|
(0.00264)
|
(0.00149)
|
|
4
|
-0.000937
|
-0.000233
|
|
(0.00141)
|
(0.00103)
|
|
5
|
-0.000599
|
-0.000146
|
|
(0.00095)
|
(0.00065)
|
|
6
|
-0.000372
|
-9.01E-05
|
|
(0.00060)
|
(0.00041)
|
|
7
|
-0.000229
|
-5.56E-05
|
|
(0.00037)
|
(0.00026)
|
|
8
|
-0.000141
|
-3.43E-05
|
|
(0.00024)
|
(0.00016)
|
|
9
|
-8.73E-05
|
-2.11E-05
|
|
(0.00016)
|
(0.00010)
|
|
10
|
-5.38E-05
|
-1.30E-05
|
|
(0.00010)
|
(6.7E-05)
|
|
Ordering: DIDH DETTE DCUIVRE
|
Tableau 8 : Décomposition de la
variance
|
Variance Decomposition of DIDH:
|
|
|
|
|
|
Period
|
S.E.
|
DIDH
|
DETTE
|
DCUIVRE
|
|
1
|
0.025811
|
100.0000
|
0.000000
|
0.000000
|
|
2
|
0.026726
|
93.58150
|
0.005459
|
6.413045
|
|
3
|
0.027234
|
90.31006
|
0.021362
|
9.668579
|
|
4
|
0.027442
|
89.06453
|
0.028243
|
10.90723
|
|
5
|
0.027521
|
88.59658
|
0.030882
|
11.37254
|
|
6
|
0.027552
|
88.41976
|
0.031883
|
11.54835
|
|
7
|
0.027563
|
88.35270
|
0.032262
|
11.61504
|
|
8
|
0.027568
|
88.32721
|
0.032407
|
11.64038
|
|
9
|
0.027569
|
88.31753
|
0.032461
|
11.65001
|
|
10
|
0.027570
|
88.31384
|
0.032482
|
11.65368
|
|
Variance Decomposition of DETTE:
|
|
|
|
|
|
Period
|
S.E.
|
DIDH
|
DETTE
|
DCUIVRE
|
|
1
|
4909.675
|
0.323582
|
99.67642
|
0.000000
|
|
2
|
5374.643
|
16.62572
|
83.36969
|
0.004596
|
|
3
|
5407.018
|
16.42768
|
82.37734
|
1.194977
|
|
4
|
5423.866
|
16.36301
|
81.86913
|
1.767864
|
|
5
|
5430.662
|
16.34182
|
81.66557
|
1.992610
|
|
6
|
5433.270
|
16.33401
|
81.58764
|
2.078349
|
|
7
|
5434.264
|
16.33106
|
81.55798
|
2.110952
|
|
8
|
5434.642
|
16.32994
|
81.54671
|
2.123349
|
|
9
|
5434.786
|
16.32952
|
81.54242
|
2.128064
|
|
10
|
5434.840
|
16.32936
|
81.54079
|
2.129857
|
|
Ordering: DIDH DETTE DCUIVRE
|
|
|
|
|
LISTE DES DONNEES
|
CUIVRE
|
DETTE
|
IDH
|
DIDH
|
DCUIVRE
|
|
2001150.
|
2858.000
|
0.275400
|
NA
|
NA
|
|
2128500.
|
3115.000
|
0.285000
|
0.009600
|
127350.0
|
|
2341000.
|
2887.000
|
0.290800
|
0.005800
|
212500.0
|
|
2332000.
|
2128.000
|
0.296000
|
0.005200
|
-9000.000
|
|
2329000.
|
262.0000
|
0.302300
|
0.006300
|
-3000.000
|
|
2328000.
|
338.0000
|
0.308100
|
0.005800
|
-1000.000
|
|
2347000.
|
4977.000
|
0.314000
|
0.005900
|
19000.00
|
|
2378000.
|
4253.000
|
0.319600
|
0.005600
|
31000.00
|
|
2361500.
|
4464.000
|
0.324500
|
0.004900
|
-16500.00
|
|
2197500.
|
2137.000
|
0.331200
|
0.006700
|
-164000.0
|
|
2126000.
|
3684.000
|
0.294000
|
-0.037200
|
-71500.00
|
|
1890000.
|
2576.000
|
0.262000
|
-0.032000
|
-236000.0
|
|
1110500.
|
1732.000
|
0.299000
|
0.037000
|
-779500.0
|
|
674965.0
|
2218.000
|
0.384000
|
0.085000
|
-435535.0
|
|
229550.0
|
1716.000
|
0.371000
|
-0.013000
|
-445415.0
|
|
146615.0
|
493.0000
|
0.381000
|
0.010000
|
-82935.00
|
|
162560.0
|
264.0000
|
0.410000
|
0.029000
|
15945.00
|
|
194410.0
|
465.0000
|
0.450000
|
0.040000
|
31850.00
|
|
180000.0
|
2458.000
|
0.479000
|
0.029000
|
-14410.00
|
|
184845.0
|
1567.000
|
0.430000
|
-0.049000
|
4845.000
|
|
148170.0
|
27488.00
|
0.430000
|
0.000000
|
-36675.00
|
|
139760.0
|
321.0000
|
0.431000
|
0.001000
|
-8410.000
|
|
105000.0
|
264.0000
|
0.363000
|
-0.068000
|
-34760.00
|
|
90745.00
|
7292.000
|
0.365000
|
0.002000
|
-14255.00
|
|
40500.00
|
15952.00
|
0.378000
|
0.013000
|
-50245.00
|
|
38445.00
|
1685.000
|
0.391000
|
0.013000
|
-2055.000
|
|
80275.00
|
2319.000
|
0.411000
|
0.020000
|
41830.00
|
|
124600.0
|
1564.000
|
0.426030
|
0.015030
|
44325.00
|
|
172700.0
|
1354.000
|
0.426700
|
0.000670
|
48100.00
|
|
208400.0
|
1605.000
|
0.434567
|
0.007867
|
35700.00
|
|
275950.0
|
1458.000
|
0.432223
|
-0.002344
|
67550.00
|
Source PNUD (Rapport annuel 1990-2008); FMI, Banque
mondiale et Rapport de la BCC
| 

