3.5 Short-term predictions
3.5.1 Effect of quarantine of undetected individuals
on the dynamics of disease transmission
The parameter a is the rate of non-detects in quarantine, the
following graphs show us the impact of this parameter on the dynamics of
disease spread.
3.5. SHORT-TERM PREDICTIONS 32
Master's thesis II * Molecular Atomic Physics and
Biophysics Laboratory-UYI * YAMENI STEINLEN DONAT D
(c)2021
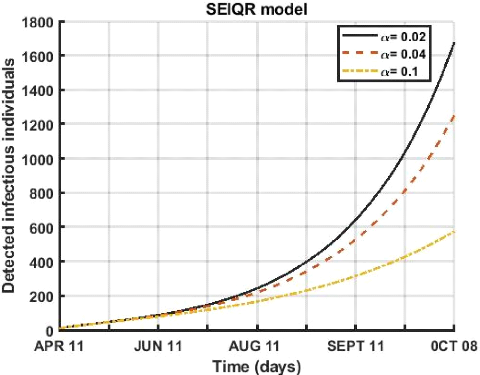
Figure 3.3: Evolution of quarantine rate of undetected
contagious over a period of 180 days for different values ( á =
0.02, á = 0.04, á = 0.1
).
Figure (3.3), shows the evolution of detected infected persons
for the period from April 12 to October 8, 2021. An increase in the quarantine
rate of undetected infectious of symptomatic humans has led to a decrease in
the number of active cases.
3.5. SHORT-TERM PREDICTIONS 33
Master's thesis II * Molecular Atomic Physics and
Biophysics Laboratory-UYI * YAMENI STEINLEN DONAT D
(c)2021
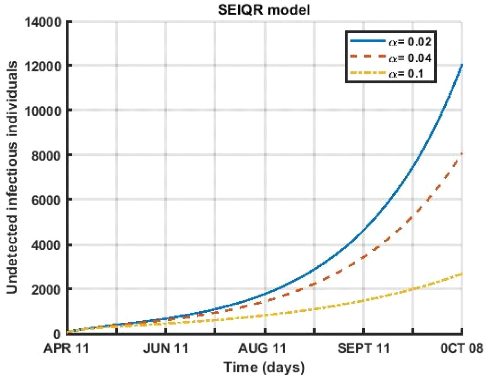
Figure 3.4: Evolution of quarantine rate of undetected
contagious over a period of 180 days for different values ( á =
0.02, á = 0.04, á = 0.1
).
Figure (3.4) shows that for the period from April 12 to October
8, 2021. An increase in the quarantine rate of undetected contagious
individuals of the disease which leads to a decrease in the number of
undetected individual cases.
3.5.2 Effect of the proportion p on the
dynamics of disease transmission
. The parameter p is the fraction exposed that becomes
undetectable infectious, the following
graphs show us the impact of this parameter on the dynamics of
propagation of the disease.
3.5. SHORT-TERM PREDICTIONS 34
Master's thesis II * Molecular Atomic Physics and
Biophysics Laboratory-UYI * YAMENI STEINLEN DONAT D
(c)2021
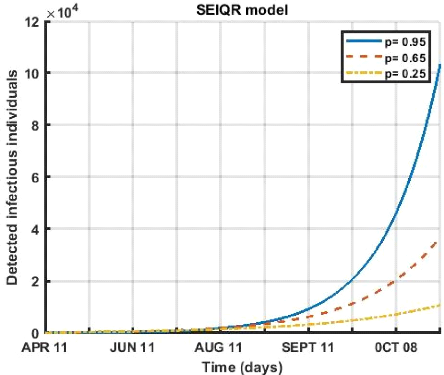
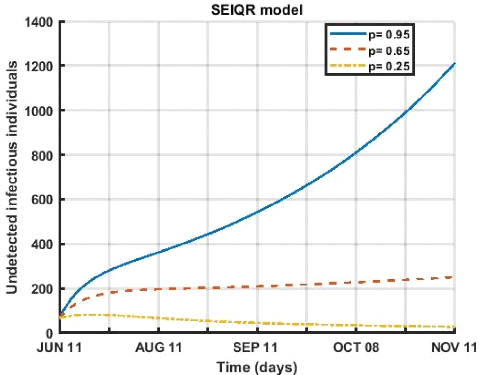
Figure 3.5: Evolution of Fraction of exposures that
become infectious undetected over a period of 180 days for different
values ( p = 0.95, p = 0.65, p = 0.25 ).
In figure (3.5), we observe a decrease in the fraction exposed
that become undetectable infectious of the disease which leads to a decrease in
the number of active cases, for the period from April 12 to October 08, 2021,
any decrease in this rate also leads to a drop in the number of patients.
3.5. SHORT-TERM PREDICTIONS 35
Master's thesis II * Molecular Atomic Physics and
Biophysics Laboratory-UYI * YAMENI STEINLEN DONAT D
(c)2021
Figure 3.6: Evolution of Fraction of exposures that
become infectious undetected over a period of 180 days for different
values ( p = 0.95, p = 0.65, p = 0.25 ).
Figure (3.6) shows that for the period from 12 April to 08
October 2021. Any decrease in the fraction of exposed individuals who become
undetectable infectious of the disease that leads to a rapid decline that tends
to cancel out as a function of time, the number of undetected individual
cases.
3.5. SHORT-TERM PREDICTIONS 36
Master's thesis II * Molecular Atomic Physics and
Biophysics Laboratory-UYI * YAMENI STEINLEN DONAT D
(c)2021
3.5. SHORT-TERM PREDICTIONS 37
Master's thesis II * Molecular Atomic Physics and
Biophysics Laboratory-UYI * YAMENI STEINLEN DONAT D
(c)2021
3.5. SHORT-TERM PREDICTIONS 38
3.5.3 Effect of the quarantine of detected individuals
on the dynamics of disease transmission
The parameter c is the rate of quarantine of infectious
individuals, the following graphs show us the impact of this parameter on the
dynamics of the disease propagation.
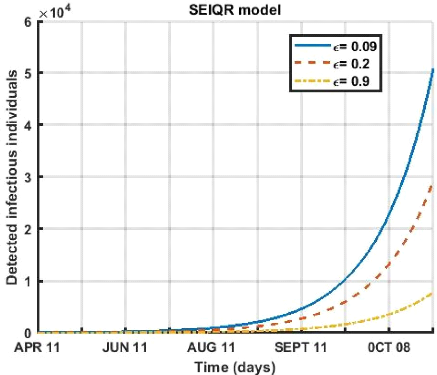
Figure 3.7: Evolution of the quarantine rate of contagious
diseases detected over a period of 180 days for different values ( € =
0.09, € = 0.02, € = 0.1 ).
Figure (3.7) depicting for the period from April 12 to October
08, 2021. Any increase in the rate of quarantine of infectious individuals
leads to a decrease in the number of active cases of the sick.
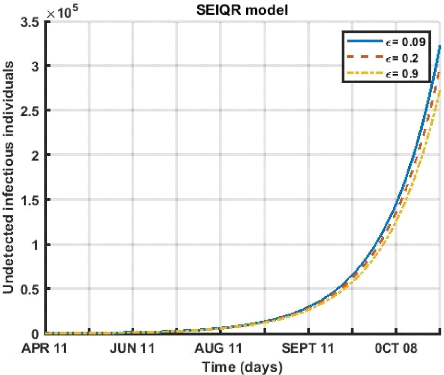
Figure 3.8: Evolution of the quarantine rate of contagious
diseases detected over a period of 180 days for different values ( € =
0.09, € = 0.02, € = 0.1 ).
Figure (3.8) shows that for the period from April 12 to
October 8, 2021. An increase in the rate of quarantine of infectious
individuals leads to a slight decrease in the number of undetected symptomatic
cases of the sick.
Master's thesis II * Molecular Atomic Physics and
Biophysics Laboratory-UYI * YAMENI STEINLEN DONAT D
(c)2021
|