3.5.4 Effect of social distancing and the use of the
face mask
The parameters and are the rate of social distancing and the
use of the face mask , the following graphs show us the impact of this
parameter on the dynamics of the disease propagation.
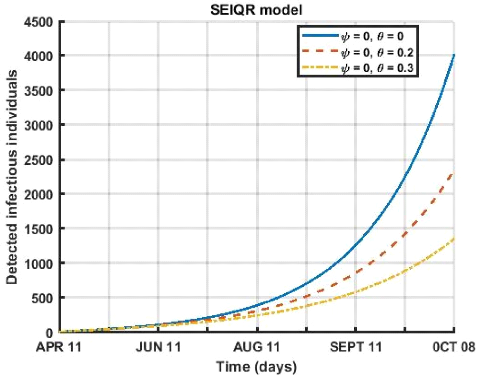
Figure 3.9: Evolution of social distancing and face mask use
over a 180-day period for different values ( = 0,0 = 0; = 0,0
= 0.2; = 0,0 = 0.3 ).
Here, in figure (3.9) we study the influence of the respect of
the barrier measures (mask wearing and social distancing) on the compartment of
detected infects. We notice that for a period going from April 12 to October 8,
2021 that within a population that does not respect the distancing ( = 0) the
detected infects decreases as the rate of mask wearing increases.
3.5. SHORT-TERM PREDICTIONS 39
Master's thesis II * Molecular Atomic Physics and
Biophysics Laboratory-UYI * YAMENI STEINLEN DONAT D
(c)2021
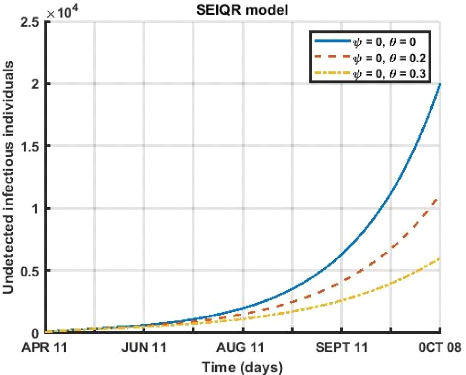
Figure 3.10: Evolution of social distancing and face
mask use over a 180-day period for different values ( = 0,0 = 0; = 0,0
= 0.2; = 0,0 = 0.3 ).
In this figure (3.10) we study the influence of the respect of
the barrier measures (wearing a mask and social distancing) on the compartment
of undetected infects. We notice that for a period going from April 12 to
October 8, that within a population that does not respect the distancing
(ø = 0) the undetected infects decreases as the rate of wearing a mask
increases.
3.5. SHORT-TERM PREDICTIONS 40
Master's thesis II * Molecular Atomic Physics and
Biophysics Laboratory-UYI * YAMENI STEINLEN DONAT D
(c)2021
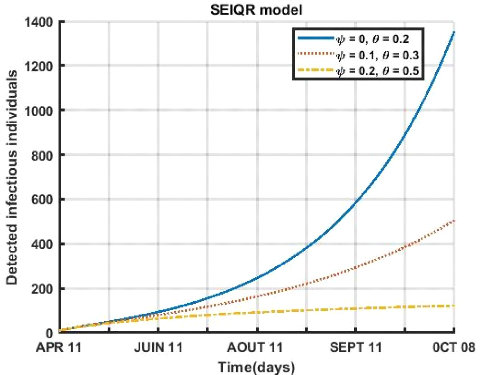
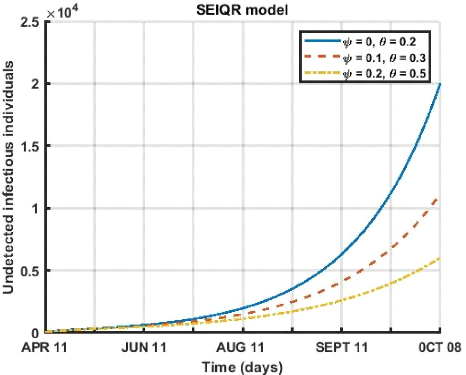
Figure 3.11: Evolution of social distancing and face
mask use over a period of 180 days for different values ( = 0,0 = 0.2;
= 0.1,0 = 0.3; = 0.2,0 = 0.5 ).
La figure (3.11) influence of the respect of the barrier
measures (wearing a mask and social distancing) on the compartment of detected
infects. We can see that for a period from April 12 to October 8, 2021 in a
population that respects less social distancing (ø = 0.1) and the
wearing of a face mask (è = 0.3) the detected infects decreases when the
rate of wearing a mask and social distancing increases.
3.5. SHORT-TERM PREDICTIONS 41
Master's thesis II * Molecular Atomic Physics and
Biophysics Laboratory-UYI * YAMENI STEINLEN DONAT D
(c)2021
Figure 3.12: Evolution of social distancing and face
mask use over a 180-day period for different values ( = 0,0 = 0.2; =
0.1,0 = 0.3; = 0.2,0 = 0.5 ).
Figure (3.12) shows the influence of the respect of the
barrier measures (wearing a mask and social distancing) on the compartment of
undetected infects. For a period from April 12 to October 8, 2021, in a
population that respects less social distancing (ø = 0.1) and face
masking (è = 0.3), the undetected infects decreases as the rate of mask
wearing and social distancing increases.
3.5. SHORT-TERM PREDICTIONS 42
Master's thesis II * Molecular Atomic Physics and
Biophysics Laboratory-UYI * YAMENI STEINLEN DONAT D
(c)2021
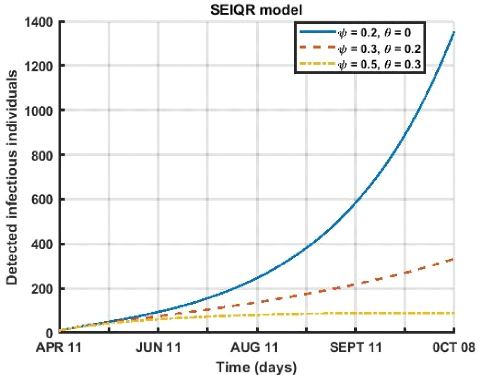
Figure 3.13: Evolution of social distancing and face
mask use over a 180-day period for different values ( = 0.2,0 = 0; =
0.3,0 = 0.2; = 0.5,0 = 0.3 ).
Figure (3.13) describes the influence of the respect of the
barrier measures (wearing a mask and social distancing) on the compartment of
detected infects. This dynamic shows that for a period going from April 12 to
October 8, 2021 that within a population that respects more social distancing
(ø = 0.5) and the wearing of a face mask (è = 0.3) the detected
infects decreases very quickly as a function of time when the rate of wearing a
mask and social distancing are high.
3.5. SHORT-TERM PREDICTIONS 43
Master's thesis II * Molecular Atomic Physics and
Biophysics Laboratory-UYI * YAMENI STEINLEN DONAT D
(c)2021
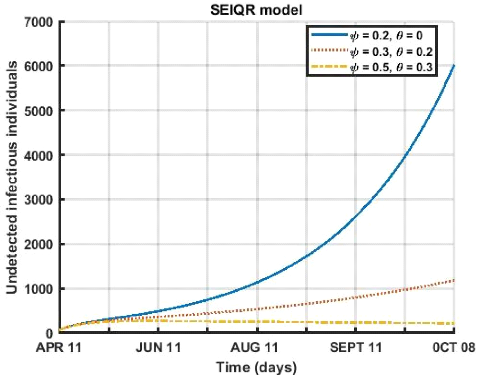
Figure 3.14: Evolution of social distancing and face mask use
over a 180-day period for different values ( = 0.2,0 = 0; = 0.3,0 = 0.2; =
0.5,0 = 0.3 ).
Figure (3.14) shows the different variations in the influence
of the respect of the barrier measures (wearing a mask and social distancing)
on the compartment of undetected infections. We see that for a period from
April 12 to October 8, 2021, in a population that respects more social
distancing (ø = 0.5) and wearing a face mask (è = 0.3), the
number of undetected infects decreases very quickly as a function of time when
the rate of wearing a mask and social distancing are high.
3.6. DISCUSSION 44
|