Section 1: General Background Information
Q1: Age
Table 2.1. Respondents' Age
|
Age
|
Frequency
|
Percentage
|
|
18-20
|
29
|
32%
|
|
21-24
|
48
|
54%
|
|
25-29
|
07
|
08%
|
|
30 and Above
|
05
|
06%
|
|
Total
|
89
|
100%
|
26
CHAPTER TWO METHODOLOGY, DATA ANALYSIS AND
INTERPRETATION
Statistical Description of the Population
Table 2.2. Statistical Indicators of the Age of
Respondents
|
Mean
|
21,97
|
|
Medium
|
21
|
|
Mode
|
21
|
The study sample consists of 89 students. The
participants' ages range from 18 to 39 years,
with a mean age of approximately 22 years and
a standard deviation of 3.60, indicating a
moderately varied age distribution. The most frequent age recorded
(mode) is 21, while the median
age also stands at 21, suggesting that the central
tendency of the age distribution is consistent. Although the majority of
participants fall within the typical university age bracket of 18
to 25 years, a few outliers were observed, extending
the age range into the early and late 30s. This diversity in
age may reflect differences in academic trajectories, re-enrollment, or
professional development goals.
Q1: Gender
Table 2.3. Respondents' Gender
|
Response
|
Frequency
|
Percentage
|
|
Female
|
58
|
65%
|
|
Male
|
31
|
35%
|
|
Total
|
89
|
100%
|
27
CHAPTER TWO METHODOLOGY, DATA ANALYSIS AND
INTERPRETATION
Total
Female Male
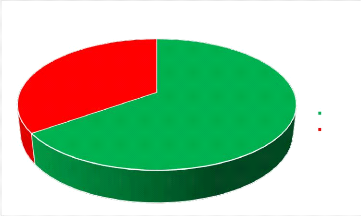
Figure 2.5. Respondents' Gender
The study sample comprised 89 participants,
of whom 58 (65%) were female and 31
(35%) were male. This notable predominance of female
respondents may be attributed to a combination of factors, including greater
availability and a stronger sense of cooperation among female students.
Previous research and anecdotal observations suggest that female students are
often more responsive to academic surveys and more willing to engage in
research activities, which could explain their higher representation in the
present sample.
Q3: What is your field of study?
Table 2.4. Respondents' Field of Study
|
Field
|
Frequency
|
Percentage
|
|
Science
|
44
|
49%
|
|
Technology
|
45
|
51%
|
|
Total
|
89
|
100%
|
CHAPTER TWO METHODOLOGY, DATA ANALYSIS AND
INTERPRETATION
Total
Science Technology
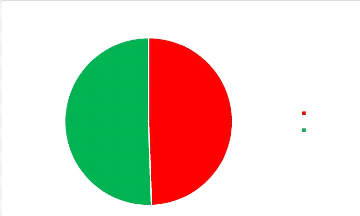
Figure 2.6. Respondents' Field of Study
The researchers aimed to ensure equal representation of
participants from both the Institute of Technology and the Institute of
Science. However, due to the accidental loss of the initial nine responses, the
final sample consisted of 89 participants, which slightly
limited the achievement of perfect equivalence. Nonetheless, a relatively
balanced distribution was maintained, with 45 responses
(51%) from the Institute of Technology and 44
responses (49%) from the Institute of Science.
Q4: What is your current year of study?
28
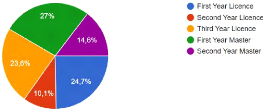
Figure 2.7. Respondents' Level of Study
29
CHAPTER TWO METHODOLOGY, DATA ANALYSIS AND
INTERPRETATION
To ensure a comprehensive understanding of the transition to
English as a Medium of Instruction (EMI), the questionnaire was distributed to
students spanning all levels of study within both the Institute of Science and
the Institute of Technology. This approach was intended to capture the
potentially diverse linguistic backgrounds, varying perceptions of the
transition, and age-related differences in judgments among the student body.
The collected data indicates that 58.4% of respondents were
enrolled in undergraduate programs (Licence L1, L2, and L3), while
41.6% were pursuing Master's degrees (Master levels M1 and
M2). This distribution closely reflects the overall demographic composition of
the populations of Algerian university student.
Q5: What is your primary language of instruction
before the transition to English?
Table 2.5. Respondents' Linguistic
Background
|
Language
|
Frequency
|
Percentage
|
|
Arabic
|
25
|
28%
|
|
French
|
62
|
70%
|
|
Other
|
2
|
2%
|
|
Total
|
89
|
100%
|
Arabic
French
Other
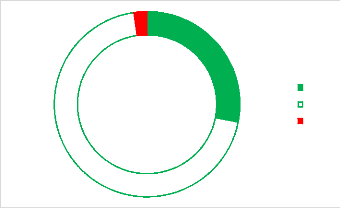
Figure 2.8. Respondents' Linguistic
Background
CHAPTER TWO METHODOLOGY, DATA ANALYSIS AND
INTERPRETATION
The findings reveal that a significant majority of respondents
(70%) reported using French as the primary language of
instruction prior to the adoption of English as a Medium of Instruction (EMI),
while 28% indicated the use of Arabic and 2%
referred to other languages. This distribution mirrors the linguistic
landscape of Algerian higher education, where French traditionally serves as
the dominant medium of instruction in scientific and technical disciplines.
Moreover, it suggests that most students are already accustomed to studying
through a foreign language, which may influence their adaptability to EMI.
Q6: How do you scale your English
proficiency?
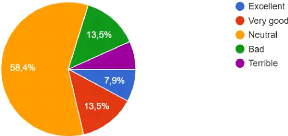
30
Figure 2.9. Respondents' English
Proficiency
The data reveals a varied distribution of self-perceived
language competence among students. Only 7.9% of respondents
rated their English proficiency as excellent, and 13.5%
considered it very good. A notable majority (58.4%)
positioned themselves at a neutral level, suggesting a moderate command of the
language without strong confidence or complete deficiency. Meanwhile, another
13.5% assessed their proficiency as bad, and the remaining
respondents categorized their English as terrible. This distribution
underscores a potential challenge for the implementation of EMI, as a
substantial majority of students do not perceive themselves as having a strong
foundation in English, which may necessitate targeted
CHAPTER TWO METHODOLOGY, DATA ANALYSIS AND
INTERPRETATION
support and resources to facilitate their academic success in
this new linguistic environment.
|