ANNEXES
Tableau A1 : Critères d'information
Modèles
|
Critères
|
Logit
|
Probit
|
Décisions
|
|
L(â)
|
-40,719
|
-41,198
|
Logit
|
|
LR
|
42,374
|
41,416
|
Logit
|
|
AIC
|
1,117
|
1,126
|
Logit
|
|
BIC
|
-303,699
|
-302,741
|
Logit
|
|
BIC'
|
17,231
|
18,188
|
Probit
|
Source : Enquête personnel Projet Pédi-Test/ANRS
12165, Nos calculs
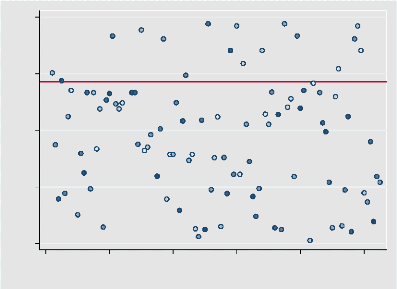
Figure A1 : Résidu standardisés
|
|
|
|
|
16
|
|
|
|
|
2 43
2021 23 41 44 60 79
54 84
11 17 36 45 69
34 67 313233 71
383940 46
10 18 78
57 61 75
42 4748 5051 55 59 6566 83
72
|
92 98
889 95 102
94 96 100 1 1
90 10
93 101
8687 91 99
|
|
12 14 19 29 35 49 5253
5 13 15 2 242728 56
8 30 58
63
62
|
67
77
68 73 76 80
70 81
|
|
37
|
64
|
|
97
|
|
|
74
|
|
|
|
|
|
0 20 40 60 80 100
numero
standardized Pearson residual
-10 -5 0 5
Source : Enquête personnel Projet Pédi-Test/ANRS
12165, Nos calculs
Attitudes et pratiques du personnel de santé
vis-à-vis du dépistage VIH des enfants
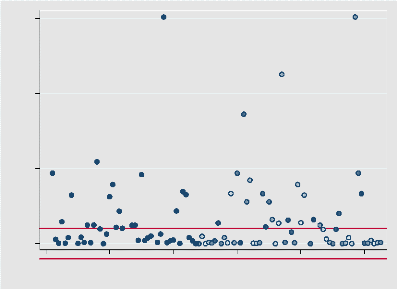
Figure A2 : Résidu de Pearson
|
|
|
|
|
16
|
|
|
|
|
2 43
20 21 23 41 44
17 54 60
11 36 84
34 67 383940 45 69 71 79
313233 46
42 4748 5051 61
55 57 75 78
10 18 59 6566 72 83
|
92 98
95 102
889 1
94 10 1
90 96 100
93 101
8687 91 99
97
|
|
12 14
5 13 15 19 2 242728 29 35 49 5253
56
8 30 58
37 62 63
|
67
68 73 76 77 80
70 81
|
|
64
|
|
|
|
|
74
|
|
|
|
|
|
0 20 40 60 80 100
numero
Pearson residual
-10 -5 0 5
Source : Enquête personnel Projet Pédi-Test/ANRS
12165, Nos calculs
Figure A3 : Leverage
leverage
0 .1 .2 .3 .4
0 20 40 60 80 100
numero
2
3
4
5
6
7
8
10
11
12
14
315
16
17
18
19
20
21
2 24
23
2728
293132
30
33
35
36
37
38
3940
41
42
43
44
45
46
47
48
49
50
51
52
53
54
55
56
57
58
5961
60
62
63
64
65
66
67
68
69
70
71
7274
73
75
76
77
78
79
80
81
83
84
86
87
88
89
90
91
92
93
94
95
96
97
98
99
100
101
102
103
104
105
Source : Enquête personnel Projet Pédi-Test/ANRS
12165, Nos calculs
Figure A4 : Dbeta
Pregibon's dbeta
0 1 2 3
0 20 40 60 80 100
numero
2
34
5
67
8
10
11121
3 1
4
16
5 1
71
18
20
9
21
2 2
23
42728
30
36
9 31323335 383940 4
37
41
4344
2
45 46 49 56
4748 50515253 5 57 59 6
54
58
60
62
1
63
64
65667
68
69
70
7173
72
74
75
76
77
78
79
80
81
83
8486
87
88 890
91
92
95
9394 96
97
98
99
1010 102
103104105
Source : Enquête personnel Projet Pédi-Test/ANRS
12165, Nos calculs
Tableau A2 : Qualité du modèle
|
Measures of Fit for logistic of Q19
|
|
|
|
Log-Lik Intercept Only:
|
-59.624
|
Log-Lik Full Model:
|
-37.727
|
|
D(82):
|
75.454
|
LR(13):
|
43.794
|
|
|
Prob > LR:
|
0.000
|
|
McFadden's R2:
|
0.367
|
McFadden's Adj R2:
|
0.132
|
|
Maximum Likelihood R2:
|
0.366
|
Cragg & Uhler's R2:
|
0.515
|
|
McKelvey and Zavoina's
|
R2: 0.575
|
Efron's R2:
|
0.454
|
|
Variance of y*:
|
7.735
|
Variance of error:
|
3.290
|
|
Count R2:
|
0.896
|
Adj Count R2:
|
0.667
|
|
AIC:
|
1.078
|
AIC*n:
|
103.454
|
|
BIC:
|
-298.822
|
BIC':
|
15.542
|
Source : Enquête personnel Projet Pédi-Test/ANRS
12165, Nos calculs
Tableau A3 : Test de Hosmer et Lemeshow
|
Logistic model for Q19, goodness-of-fit test
number of observations = 98
number of covariate patterns = 80
Pearson chi2(72) = 73.68
Prob > chi2 = 0.4228
|
Source : Enquête personnel Projet Pédi-Test/ANRS
12165, Nos calculs
Tableau A4 : Test de classification
|
Logistic model for Q19
True
Classified | D ~D | Total
+ +
+ | 63 7 | 70
- | 3 23 | 26
+ +
Total | 66 30 | 96
Classified + if predicted Pr(D) >= .5 True D defined as Q19 !=
0
Sensitivity Pr( +| D) 95.45%
Specificity Pr( -|~D) 76.67%
Positive predictive value Pr( D| +) 90.00%
Negative predictive value Pr(~D| -) 88.46%
False + rate for true ~D Pr( +|~D) 23.33%
False - rate for true D Pr( -| D) 4.55%
False + rate for classified + Pr(~D| +) 10.00%
False - rate for classified - Pr( D| -) 11.54%
Correctly classified 89.58%
|
Source : Enquête personnel Projet Pédi-Test/ANRS
12165, Nos calculs
Figure A5 : Pouvoir discriminant
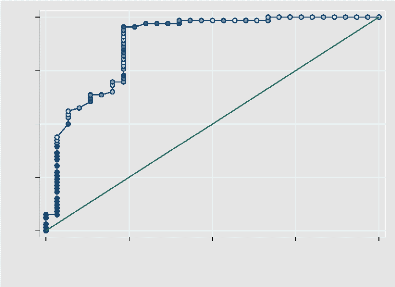
Sensitivity
0.00 0.25 0.50 0.75 1.00
0.00 0.25 0.50 0.75 1.00
1 - Specificity
Area under ROC curve = 0.8795
Source : Enquête personnel Projet Pédi-Test/ANRS
12165, Nos calculs
| 

