CONCLUSION GENERALE
T
out au long de ce mémoire on a étudié les
modèles d?évaluations des actifs financiers, la diversification
et l?impact de l?intégration des marchés des capitaux
développés et émergents et ses implications sur les gains
potentiels des stratégies de
diversification internationale de portefeuille.
Théoriquement on a étudié le modèle
d?évaluation des actifs financiers et suite au critiques et aux
anomalies adressées à ce modèle on a testé d?autres
versions comme le MEDAFI (le modèle d?évaluation des actifs
financiers à l?international), le MEDAF conditionnel, l?APT et le
modèle de Fama French (1993), le but c?est le portefeuille optimal pour
un investisseur qui cherche à maximiser leurs rentabilités.
D?ailleurs, pour assurer cette rentabilité il faut diversifier le
portefeuille par des titres domestiques sur le plan national, mais à
l?international ça dépend de la corrélation entre les
marchés financiers. Alors que L?accroissement de l?intégration
financière favorise l?augmentation des corrélations entre les
marchés nationaux ce qui réduirait les gains des
stratégies de diversification internationale. Nos résultats
prouvent que les marchés développés sont
intégrés entre eux alors que les marchés émergents
sont segmentés aussi bien entre eux qu?avec les marchés
développés. Ces conclusions sont conformes avec la
majorité des études menées sur le thème de
l?intégration des marchés financiers tel que celle de Gilmore et
McManus (2002) et Bekaert, Harvey et Ng (2003). Cela implique que ces
marchés émergents représentent encore une source
importante de diversification internationale de portefeuille. Cependant, il
faut tenir compte des transmissions des chocs surtout suite aux nombreuses
crises qui ont frappé les marchés financiers ces dernières
années.
BIBLIOGRAPHIE

BIBLIOGRAPHIE
Abou (A) et Prat (G) (1997) A propos de la rationalité des
anticipations boursières : quel niveau d'agrégation des opinions
? Revue d'Economie Politique n°5, pp. 647-69.
Abou (A) et Prat (G), (1997) Formation des anticipations
boursières : "consensus" versus opinions individuelles, Journal de la
Société de Statistique de Paris, n°2, pp. 13-22.
Abou (A.), (1997) Prix, production et cours boursiers aux
Etats-Unis : une mise en perspective des processus anticipatifs pour un panel
d'experts sur la période 1952-1996, Communication
présentée à la Journée "Aspects
microéconomiques des anticipations" du GDR "Monnaie et Financement",
24p.
Barari, M. (2003), «Measuring equity market integration
using time-varying integration score: the case of Latin America»,
Institute for international integration studies, trinity college, Dublin,
Ireland.
Bekaert, G. Harvey, C.R. et Ng, A. (2003), Market integration and
contagion?, NBER Working Paper, N° 9510.
Black (F.), (1972) Capital Equilibrium with restricted borrowing,
Journal of Business, n°45, pp.444-54.
Bourguinat H., (1999), « Finance internationale »,
PUF
Brealey R. Myers S., (2003), « Principes de Gestion
Financière », Pearson Education.
Chou, R.Y., Ng, V. K. et Pi, L. K. (1994), Cointégration
of international stock market indices?, IMF Working Papers 94.
Cobbaut R (1997), « Théorie Financière »,
Economica.
FADHLAOUI.K.(2006) « Diversification internationale et
intégration financière : Lintérêt des
marchés émergents ».
Forbes, K. et Rigobon, R. (2000), contagion in Latin America:
definitions, measurement and policy implications?, NBER Working Paper , N°
7885.
Gilmore, C. G. et McManus, G. M. (2002), International portfolio
diversification: US and central European equity markets?, Emerging Markets
Review, Vol. 3, PP. 69-83.
Heaney, R., Hooper, V. et Jaugietis, M. (2002), Regional
integration of stock markets in latin America?, Journal of Economic
Integration, Vol. 17, PP.745-760.
Heimonen, K. (2002), Stock market integration; evidence on price
integration return convergence?, Applied Financial Economics.Vol. 12, PP.
415-429.
Henry, P. B. (2000), Stock market liberalisation, economic reform
and emerging equity prices?, Journal of Finance, Vol. 55, PP.529-564.
Jean-Marie CLUCHIER 11/08/2008 « Construction de
portefeuille et diversification "
Kais FADHLAOUI (2006) Diversification internationale et
intégration financière : L?intérêt des
marchés émergents
Lahouel NOUREDDINE (2006) working paper « Evaluation des
Options avec Prime de Risque "
Malkiel, B. et Mei, J. (1998), Global bargain hunting: the
investors guide to profits in emerging markets?, Simon &
Schuster, New York.
Manning, N. (2002), Common trends and convergence? South East
Asian equity markets, 1988-1999?, Journal of International Money and Finance,
Vol. 21, PP.183-202. Markowitz, «portfolio sélection ", Journal of
Finance, mars 1952. Mathis J., (2001), « Marchés internationaux des
capitaux et Gestion dactifs», Economica
Nihat AKTAS (2004) La « finance comportementale " un
état des lieux
Olga Bourachnikova (2009) « la théorie
comportementale de portefeuille vs. Le modèle moyenne -variance. "
Working paper
Prat (G.), (1992) Anticipations et évaluation des actions,
in "Monnaie, taux d'intérêt et anticipations", H. Kempf et W.
Marois ed. Economica.
Prat (G.), (1982)La bourse et la conjoncture économique,
Economica.
Roll.R et S.A.Ross, (1977) ?An empirical investigation of the
arbitrage pricing theory?.
Roll.R, (1977) « A critique of the asset pricing
theorys test: part 1 .on past and potential testability of theory
», Journal of financial Economics, vol.4, pp.129-176.
Solnik,B.(1983),international Arbitrage Pricing Theory»
Journal of Finance,Vol.38,pp.449- 457
ANNEXES
075
000
12
07
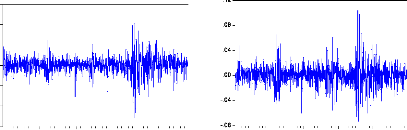
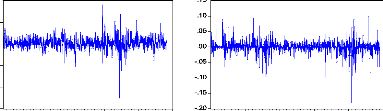
Annexes 1 : L'évolution des indices bousiers des
différentes zones étudiées


Annexe 2 : Corrélations des rendements des pays
développé.
|
Zone de l'Europe
|
|
BE20
|
CAC40
|
AEX
|
DAX
|
FTSE100
|
SSMI
|
MIB30
|
|
BE20
|
1
|
0.6341
|
0.6591
|
0.2998
|
0.5409
|
0.5317
|
0.1917
|
|
CAC40
|
|
1
|
0.9480
|
0.2508
|
0.6580
|
0.6218
|
0.2274
|
|
AEX
|
|
|
1
|
0.2356
|
0.6669
|
0.6169
|
0.2478
|
|
DAX
|
|
|
|
1
|
0.3337
|
0.2472
|
0.2371
|
|
FTSE100
|
|
|
|
|
1
|
0.680
|
0.1934
|
|
SSMI
|
|
|
|
|
|
1
|
0.2332
|
|
MIB30
|
|
|
|
|
|
|
1
|

Tableau 16 : corrélations des rendements des zones
à économies de l?Europe. Zone de l'Amérique du
nord
|
SPTSX
|
SP500
|
|
SPTSX
|
1
|
0.3478
|
|
SP500
|
|
1
|
Tableau 17 : Corrélations des rendements des zones
à économies de l?Amérique du nord
Corrélations des rendements des pays
émergents.

Zone de l'Asie.
|
ALLO
RDIN
ARIE
|
BSE30
|
HANG
SENG
|
JKSE
|
KLSE
|
NIKK
EI225
|
KS11
|
SHANGC
OMP
|
STI
|
|
ALLORDIN
ARIE
|
1
|
0.0780
|
0.2012
|
-0.0081
|
0.0212
|
0.1927
|
0.1054
|
0.0407
|
0.0330
|
|
BSE30
|
|
1
|
0.0755
|
0.2088
|
0.1506
|
0.2159
|
0.1484
|
0.0688
|
0.0981
|
|
HANGSENG
|
|
|
1
|
0.0335
|
0.0183
|
0.0885
|
0.4107
|
0.0998
|
0.2865
|
|
JKSE
|
|
|
|
1
|
0.0417
|
0.2818
|
0.0161
|
0.1294
|
0.2714
|
|
KLSE
|
|
|
|
|
1
|
0.1700
|
0.0473
|
0.0661
|
0.0597
|
|
NIKKEI225
|
|
|
|
|
|
1
|
0.0725
|
0.0658
|
0.1111
|
|
KS11
|
|
|
|
|
|
|
1
|
0.1003
|
0.2069
|
|
SHANGCO
MP
|
|
|
|
|
|
|
|
1
|
0.0368
|
|
STI
|
|
|
|
|
|
|
|
|
1
|
Tableau 18 : Corrélations des rendements de la zone de
l?Asie

=W CI l* P pUTuERINine.
|
BOVESPA
|
IPC
|
MERVAL
|
|
BOVESPA
|
1
|
0.4583
|
0.3461
|
|
IPC
|
|
1
|
0.3091
|
|
MERVAL
|
|
|
1
|
Tableau 19 : Corrélations des rendements de la zone de
l?Amérique latine
|
=MICR* IUTME
|
|
EGX30
|
TUNINDEX
|
|
EGX30
|
1
|
0.0005
|
|
TUNINDEX
|
|
1
|
Tableau 20 : Corrélations des rendements de la zone de
l?Afrique

Annexe 3 : Test de Ducky- Fuller simple pour les pays
développé Zone de l'Europe.
Royaume - Uni (Au niveau et En
différence)
Null Hypothesis: FTSE100 has a unit root
Exogenous: Constant, Linear Trend
Lag Length: 14 (Automatic based on Modified SIC, MAXLAG=22)
t-Statistic Prob.*
Augmented Dickey-Fuller test statistic -1.826981 0.6912
Test critical values: 1% level -3.965494
5% level -3.413454
10% level -3.128769
*MacKinnon (1996) one-sided p-values. Augmented Dickey-Fuller
Test Equation Dependent Variable: D(FTSE100)
Method: Least Squares
Date: 05/30/11 Time: 11:41
Sample (adjusted): 16 1250
Included observations: 1250 after adjustments
|
Variable
|
Coefficient
|
Std. Error t-Statistic
|
Prob.
|
|
C
|
183.4527
|
97.62340 1.879188
|
0.0605
|
|
@TREND(1)
|
-0.035537
|
0.034634 -1.026059
|
0.3051
|
|
R-squared
|
0.424041
|
Mean dependent var
|
0.590202
|
|
Adjusted R-squared
|
0.416475
|
S.D. dependent var
|
524.0094
|
|
S.E. of regression
|
400.2847
|
Akaike info criterion
|
14.83590
|
|
Sum squared resid
|
1.95E+08
|
Schwarz criterion
|
14.90636
|
|
Log likelihood
|
-9144.167
|
Hannan-Quinn criter.
|
14.86240
|
|
F-statistic
|
56.04575
|
Durbin-Watson stat
|
1.999134
|
|
Prob(F-statistic)
|
0.000000
|
|
|
84
Null Hypothesis: D(FTSE100) has a unit root
Exogenous: Constant, Linear Trend
Lag Length: 0 (Automatic based on Modified SIC, MAXLAG=22)
t-Statistic Prob.*
Augmented Dickey-Fuller test statistic -60.49416 0.0001
Test critical values: 1% level -3.965416
5% level -3.413416
10% level -3.128746
*MacKinnon (1996) one-sided p-values. Augmented Dickey-Fuller
Test Equation Dependent Variable: D(FTSE100,2)
Method: Least Squares
Date: 05/30/11 Time: 11:41
Sample (adjusted): 3 1250
Included observations: 1250 after adjustments
|
Variable
|
Coefficient
|
Std. Error t-Statistic
|
Prob.
|
|
C
|
1.976530
|
25.75440 0.076745
|
0.9388
|
|
@TREND(1)
|
-0.001926
|
0.035679 -0.053976
|
0.9570
|
|
R-squared
|
0.746154
|
Mean dependent var
|
0.012260
|
|
Adjusted R-squared
|
0.745746
|
S.D. dependent var
|
900.5584
|
|
S.E. of regression
|
454.0940
|
Akaike info criterion
|
15.07689
|
|
Sum squared resid
|
2.57E+08
|
Schwarz criterion
|
15.08922
|
|
Log likelihood
|
-9404.977
|
Hannan-Quinn criter.
|
15.08152
|
|
F-statistic
|
1829.772
|
Durbin-Watson stat
|
2.315436
|
|
Prob(F-statistic)
|
0.000000
|
|
|
-France (Au niveau et En différence)
Null Hypothesis: CAC40 has a unit root
Exogenous: Constant, Linear Trend
Lag Length: 1 (Automatic based on Modified SIC, MAXLAG=22)
t-Statistic Prob.*
Augmented Dickey-Fuller test statistic -1.816092 0.6966
Test critical values: 1% level -3.965416
5% level -3.413416
10% level -3.128746
*MacKinnon (1996) one-sided p-values. Augmented Dickey-Fuller
Test Equation Dependent Variable: D(CAC40)
Method: Least Squares
Date: 05/30/11 Time: 11:40
Sample (adjusted): 3 1250
Included observations: 1250 after adjustments
|
Variable
|
Coefficient
|
Std. Error t-Statistic
|
Prob.
|
|
C
|
24.92624
|
12.67051 1.967264
|
0.0494
|
|
@TREND(1)
|
-0.010028
|
0.005739 -1.747345
|
0.0808
|
|
R-squared
|
0.012690
|
Mean dependent var
|
-0.097075
|
|
Adjusted R-squared
|
0.010309
|
S.D. dependent var
|
63.15981
|
|
S.E. of regression
|
62.83341
|
Akaike info criterion
|
11.12205
|
|
Sum squared resid
|
4911358.
|
Schwarz criterion
|
11.13849
|
|
Log likelihood
|
-6936.160
|
Hannan-Quinn criter.
|
11.12823
|
|
F-statistic
|
5.329845
|
Durbin-Watson stat
|
2.004031
|
|
Prob(F-statistic)
|
0.001192
|
|
|
Null Hypothesis: D(CAC40) has a unit root
Exogenous: Constant, Linear Trend
Lag Length: 21 (Automatic based on Modified SIC, MAXLAG=22)
t-Statistic Prob.*
Augmented Dickey-Fuller test statistic -6.937211 0.0000
Test critical values: 1% level -3.965543
5% level -3.413478
10% level -3.128783
*MacKinnon (1996) one-sided p-values. Augmented Dickey-Fuller
Test Equation Dependent Variable: D(CAC40,2)
Method: Least Squares
Date: 05/30/11 Time: 11:40
Sample (adjusted): 24 1250
Included observations: 1250 after adjustments
|
Variable
|
Coefficient
|
Std. Error t-Statistic
|
Prob.
|
|
C
|
2.653840
|
3.733518 0.710815
|
0.4773
|
|
@TREND(1)
|
-0.004404
|
0.005150 -0.855177
|
0.3926
|
|
R-squared
|
0.559084
|
Mean dependent var
|
0.003415
|
|
Adjusted R-squared
|
0.550654
|
S.D. dependent var
|
94.19919
|
|
S.E. of regression
|
63.14482
|
Akaike info criterion
|
11.14810
|
|
Sum squared resid
|
4796683.
|
Schwarz criterion
|
11.24810
|
|
Log likelihood
|
-6815.362
|
Hannan-Quinn criter.
|
11.18573
|
|
F-statistic
|
66.32210
|
Durbin-Watson stat
|
1.997613
|
|
Prob(F-statistic)
|
0.000000
|
|
|
-Allemagne (Au niveau et En
différence)
Null Hypothesis: DAX has a unit root
Exogenous: Constant, Linear Trend
Lag Length: 12 (Automatic based on Modified SIC, MAXLAG=22)
t-Statistic Prob.*
Augmented Dickey-Fuller test statistic -1.660388 0.7682
Test critical values: 1% level -3.965482
5% level -3.413448
10% level -3.128765
*MacKinnon (1996) one-sided p-values. Augmented Dickey-Fuller
Test Equation Dependent Variable: D(DAX)
Method: Least Squares
Date: 05/30/11 Time: 11:40
Sample (adjusted): 14 1250
Included observations: 1250 after adjustments
|
Variable
|
Coefficient
|
Std. Error t-Statistic
|
Prob.
|
|
C
|
75.84281
|
38.81177 1.954119
|
0.0509
|
|
@TREND(1)
|
-0.018582
|
0.018921 -0.982116
|
0.3262
|
|
R-squared
|
0.550101
|
Mean dependent var
|
1.290493
|
|
Adjusted R-squared
|
0.544947
|
S.D. dependent var
|
351.0504
|
|
S.E. of regression
|
236.8102
|
Akaike info criterion
|
13.78445
|
|
Sum squared resid
|
68528616
|
Schwarz criterion
|
13.84654
|
|
Log likelihood
|
-8510.680
|
Hannan-Quinn criter.
|
13.80780
|
|
F-statistic
|
106.7263
|
Durbin-Watson stat
|
2.003564
|
|
Prob(F-statistic)
|
0.000000
|
|
|
Null Hypothesis: D(DAX) has a unit root
Exogenous: Constant, Linear Trend
Lag Length: 0 (Automatic based on Modified SIC, MAXLAG=22)
t-Statistic Prob.*
Augmented Dickey-Fuller test statistic -58.95777 0.0000
Test critical values: 1% level -3.965416
5% level -3.413416
10% level -3.128746
*MacKinnon (1996) one-sided p-values. Augmented Dickey-Fuller
Test Equation Dependent Variable: D(DAX,2)
Method: Least Squares
Date: 05/30/11 Time: 11:41
Sample (adjusted): 3 1250
Included observations: 1250 after adjustments
|
Variable
|
Coefficient
|
Std. Error t-Statistic
|
Prob.
|
|
C
|
7.184216
|
17.48378 0.410908
|
0.6812
|
|
@TREND(1)
|
-0.008515
|
0.024221 -0.351552
|
0.7252
|
|
R-squared
|
0.736286
|
Mean dependent var
|
0.007748
|
|
Adjusted R-squared
|
0.735862
|
S.D. dependent var
|
599.7965
|
|
S.E. of regression
|
308.2615
|
Akaike info criterion
|
14.30217
|
|
Sum squared resid
|
1.18E+08
|
Schwarz criterion
|
14.31450
|
|
Log likelihood
|
-8921.557
|
Hannan-Quinn criter.
|
14.30681
|
|
F-statistic
|
1738.010
|
Durbin-Watson stat
|
2.276823
|
|
Prob(F-statistic)
|
0.000000
|
|
|
Italie (Au niveau et En différence)
Null Hypothesis: MIB30 has a unit root
Exogenous: Constant, Linear Trend
Lag Length: 3 (Automatic based on Modified SIC, MAXLAG=22)
t-Statistic Prob.*
Augmented Dickey-Fuller test statistic -1.764548 0.7215
Test critical values: 1% level -3.965428
5% level -3.413422
10% level -3.128749
*MacKinnon (1996) one-sided p-values. Augmented Dickey-Fuller
Test Equation Dependent Variable: D(MIB30)
Method: Least Squares
Date: 05/30/11 Time: 11:41
Sample (adjusted): 5 1250
Included observations: 1250 after adjustments
|
Variable
|
Coefficient
|
Std. Error t-Statistic
|
Prob.
|
|
C
|
438.5926
|
233.8361 1.875641
|
0.0609
|
|
@TREND(1)
|
-0.248286
|
0.123222 -2.014937
|
0.0441
|
|
R-squared
|
0.435372
|
Mean dependent var
|
-7.232592
|
|
Adjusted R-squared
|
0.433095
|
S.D. dependent var
|
1518.526
|
|
S.E. of regression
|
1143.345
|
Akaike info criterion
|
16.92611
|
|
Sum squared resid
|
1.62E+09
|
Schwarz criterion
|
16.95080
|
|
Log likelihood
|
-10538.96
|
Hannan-Quinn criter.
|
16.93539
|
|
F-statistic
|
191.2272
|
Durbin-Watson stat
|
1.945528
|
|
Prob(F-statistic)
|
0.000000
|
|
|
Null Hypothesis: D(MIB30) has a unit root
Exogenous: Constant, Linear Trend
Lag Length: 0 (Automatic based on Modified SIC, MAXLAG=22)
t-Statistic Prob.*
Augmented Dickey-Fuller test statistic -58.96631 0.0000
Test critical values: 1% level -3.965416
5% level -3.413416
10% level -3.128746
*MacKinnon (1996) one-sided p-values. Augmented Dickey-Fuller
Test Equation Dependent Variable: D(MIB30,2)
Method: Least Squares
Date: 05/30/11 Time: 11:42
Sample (adjusted): 3 1250
Included observations: 1250 after adjustments
|
Variable
|
Coefficient
|
Std. Error t-Statistic
|
Prob.
|
|
C
|
22.44923
|
75.89679 0.295786
|
0.7674
|
|
@TREND(1)
|
-0.053148
|
0.105147 -0.505460
|
0.6133
|
|
R-squared
|
0.736342
|
Mean dependent var
|
-0.010144
|
|
Adjusted R-squared
|
0.735918
|
S.D. dependent var
|
2604.015
|
|
S.E. of regression
|
1338.174
|
Akaike info criterion
|
17.23840
|
|
Sum squared resid
|
2.23E+09
|
Schwarz criterion
|
17.25073
|
|
Log likelihood
|
-10753.76
|
Hannan-Quinn criter.
|
17.24304
|
|
F-statistic
|
1738.513
|
Durbin-Watson stat
|
2.273582
|
|
Prob(F-statistic)
|
0.000000
|
|
|
Suisse (Au niveau et En différence)
Null Hypothesis: SSMI has a unit root
Exogenous: Constant, Linear Trend
Lag Length: 14 (Automatic based on Modified SIC, MAXLAG=22)
t-Statistic Prob.*
Augmented Dickey-Fuller test statistic -1.910137 0.6486
Test critical values: 1% level -3.965494
5% level -3.413454
10% level -3.128769
*MacKinnon (1996) one-sided p-values. Augmented Dickey-Fuller
Test Equation Dependent Variable: D(SSMI)
Method: Least Squares
Date: 05/30/11 Time: 11:42
Sample (adjusted): 16 1250
Included observations: 1250 after adjustments
|
Variable
|
Coefficient
|
Std. Error t-Statistic
|
Prob.
|
|
C
|
107.5393
|
50.91261 2.112234
|
0.0349
|
|
@TREND(1)
|
-0.035588
|
0.021736 -1.637277
|
0.1018
|
|
R-squared
|
0.505069
|
Mean dependent var
|
0.755789
|
|
Adjusted R-squared
|
0.498567
|
S.D. dependent var
|
351.6663
|
|
S.E. of regression
|
249.0217
|
Akaike info criterion
|
13.88663
|
|
Sum squared resid
|
75530357
|
Schwarz criterion
|
13.95709
|
|
Log likelihood
|
-8557.992
|
Hannan-Quinn criter.
|
13.91313
|
|
F-statistic
|
77.68427
|
Durbin-Watson stat
|
2.014279
|
|
Prob(F-statistic)
|
0.000000
|
|
|
Null Hypothesis: D(SSMI) has a unit root
Exogenous: Constant, Linear Trend
Lag Length: 0 (Automatic based on Modified SIC, MAXLAG=22)
t-Statistic Prob.*
Augmented Dickey-Fuller test statistic -58.81346 0.0000
Test critical values: 1% level -3.965416
5% level -3.413416
10% level -3.128746
*MacKinnon (1996) one-sided p-values. Augmented Dickey-Fuller
Test Equation Dependent Variable: D(SSMI,2)
Method: Least Squares
Date: 05/30/11 Time: 11:42
Sample (adjusted): 3 1250
Included observations: 1250 after adjustments
|
Variable
|
Coefficient
|
Std. Error t-Statistic
|
Prob.
|
|
C
|
6.862434
|
17.52060 0.391678
|
0.6954
|
|
@TREND(1)
|
-0.009322
|
0.024272 -0.384040
|
0.7010
|
|
R-squared
|
0.735333
|
Mean dependent var
|
-0.004968
|
|
Adjusted R-squared
|
0.734908
|
S.D. dependent var
|
599.9786
|
|
S.E. of regression
|
308.9116
|
Akaike info criterion
|
14.30639
|
|
Sum squared resid
|
1.19E+08
|
Schwarz criterion
|
14.31872
|
|
Log likelihood
|
-8924.186
|
Hannan-Quinn criter.
|
14.31102
|
|
F-statistic
|
1729.512
|
Durbin-Watson stat
|
2.276471
|
|
Prob(F-statistic)
|
0.000000
|
|
|
Pays - Bad (Au niveau et En
différence)
Null Hypothesis: AEX has a unit root
Exogenous: Constant, Linear Trend
Lag Length: 0 (Automatic based on Modified SIC, MAXLAG=22)
t-Statistic Prob.*
Augmented Dickey-Fuller test statistic -1.604094 0.7912
Test critical values: 1% level -3.965410
5% level -3.413413
10% level -3.128744
*MacKinnon (1996) one-sided p-values. Augmented Dickey-Fuller
Test Equation Dependent Variable: D(AEX)
Method: Least Squares
Date: 05/30/11 Time: 11:39
Sample (adjusted): 2 1250
Included observations: 1250 after adjustments
|
Variable
|
Coefficient
|
Std. Error t-Statistic
|
Prob.
|
|
C
|
1.684029
|
0.969984 1.736141
|
0.0828
|
|
@TREND(1)
|
-0.000794
|
0.000500 -1.586054
|
0.1130
|
|
R-squared
|
0.002679
|
Mean dependent var
|
-0.026085
|
|
Adjusted R-squared
|
0.001078
|
S.D. dependent var
|
5.447239
|
|
S.E. of regression
|
5.444302
|
Akaike info criterion
|
6.229415
|
|
Sum squared resid
|
36931.98
|
Schwarz criterion
|
6.241737
|
|
Log likelihood
|
-3887.270
|
Hannan-Quinn criter.
|
6.234048
|
|
F-statistic
|
1.673276
|
Durbin-Watson stat
|
2.089362
|
|
Prob(F-statistic)
|
0.188053
|
|
|
Null Hypothesis: D(AEX) has a unit root
Exogenous: Constant, Linear Trend
Lag Length: 21 (Automatic based on Modified SIC, MAXLAG=22)
t-Statistic Prob.*
Augmented Dickey-Fuller test statistic -6.253836 0.0000
Test critical values: 1% level -3.965543
5% level -3.413478
10% level -3.128783
*MacKinnon (1996) one-sided p-values. Augmented Dickey-Fuller
Test Equation Dependent Variable: D(AEX,2)
Method: Least Squares
Date: 05/30/11 Time: 11:39
Sample (adjusted): 24 1250
Included observations: 1227 after adjustments
|
Variable
|
Coefficient
|
Std. Error t-Statistic
|
Prob.
|
|
C
|
0.174247
|
0.321836 0.541414
|
0.5883
|
|
@TREND(1)
|
-0.000298
|
0.000444 -0.670792
|
0.5025
|
|
R-squared
|
0.535947
|
Mean dependent var
|
0.001899
|
|
Adjusted R-squared
|
0.527074
|
S.D. dependent var
|
7.937139
|
|
S.E. of regression
|
5.458337
|
Akaike info criterion
|
6.251532
|
|
Sum squared resid
|
35841.51
|
Schwarz criterion
|
6.351528
|
|
Log likelihood
|
-3811.315
|
Hannan-Quinn criter.
|
6.289158
|
|
F-statistic
|
60.40758
|
Durbin-Watson stat
|
1.996748
|
|
Prob(F-statistic)
|
0.000000
|
|
|
|
=TnFOdFOl'AP pUiINFOdN OITUd.
|
Etats #177; Unis (Au niveau et En
différence)
Null Hypothesis: SP500 has a unit root
Exogenous: Constant, Linear Trend
Lag Length: 11 (Automatic based on Modified SIC, MAXLAG=22)
t-Statistic Prob.*
Augmented Dickey-Fuller test statistic -1.994753 0.6031
Test critical values: 1% level -3.965476
5% level -3.413445
10% level -3.128763
*MacKinnon (1996) one-sided p-values. Augmented Dickey-Fuller
Test Equation Dependent Variable: D(SP500)
Method: Least Squares
Date: 05/30/11 Time: 11:35
Sample (adjusted): 13 1250
Included observations: 1250 after adjustments
|
Variable
|
Coefficient
|
Std. Error t-Statistic
|
Prob.
|
|
C
|
47.39653
|
23.84044 1.988073
|
0.0470
|
|
@TREND(1)
|
-0.011710
|
0.009706 -1.206422
|
0.2279
|
|
R-squared
|
0.430783
|
Mean dependent var
|
-0.025380
|
|
Adjusted R-squared
|
0.424737
|
S.D. dependent var
|
142.1047
|
|
S.E. of regression
|
107.7808
|
Akaike info criterion
|
12.20932
|
|
Sum squared resid
|
14218850
|
Schwarz criterion
|
12.26723
|
|
Log likelihood
|
-7543.570
|
Hannan-Quinn criter.
|
12.23110
|
|
F-statistic
|
71.25552
|
Durbin-Watson stat
|
2.005217
|
|
Prob(F-statistic)
|
0.000000
|
|
|
Null Hypothesis: D(SP500) has a unit root
Exogenous: Constant, Linear Trend
Lag Length: 0 (Automatic based on Modified SIC, MAXLAG=22)
t-Statistic Prob.*
Augmented Dickey-Fuller test statistic -60.79157 0.0001
Test critical values: 1% level -3.965416
5% level -3.413416
10% level -3.128746
*MacKinnon (1996) one-sided p-values. Augmented Dickey-Fuller
Test Equation Dependent Variable: D(SP500,2)
Method: Least Squares
Date: 05/30/11 Time: 11:35
Sample (adjusted): 3 1250
Included observations: 1250 after adjustments
|
Variable
|
Coefficient
|
Std. Error t-Statistic
|
Prob.
|
|
C
|
0.238642
|
6.975842 0.034210
|
0.9727
|
|
@TREND(1)
|
-0.000486
|
0.009664 -0.050290
|
0.9599
|
|
R-squared
|
0.748007
|
Mean dependent var
|
-0.005609
|
|
Adjusted R-squared
|
0.747602
|
S.D. dependent var
|
244.8209
|
|
S.E. of regression
|
122.9961
|
Akaike info criterion
|
12.46458
|
|
Sum squared resid
|
18834403
|
Schwarz criterion
|
12.47691
|
|
Log likelihood
|
-7774.900
|
Hannan-Quinn criter.
|
12.46922
|
|
F-statistic
|
1847.808
|
Durbin-Watson stat
|
2.324240
|
|
Prob(F-statistic)
|
0.000000
|
|
|
Canada (Au niveau et En différence)
Null Hypothesis: SPTS has a unit root
Exogenous: Constant, Linear Trend
Lag Length: 15 (Automatic based on Modified SIC, MAXLAG=22)
t-Statistic Prob.*
Augmented Dickey-Fuller test statistic -2.401543 0.3785
Test critical values: 1% level -3.965500
5% level -3.413457
10% level -3.128770
*MacKinnon (1996) one-sided p-values. Augmented Dickey-Fuller
Test Equation Dependent Variable: D(SPTS)
Method: Least Squares
Date: 05/30/11 Time: 11:35
Sample (adjusted): 17 1250
Included observations: 1250 after adjustments
|
Variable
|
Coefficient
|
Std. Error t-Statistic
|
Prob.
|
|
C
|
691.8556
|
290.1728 2.384288
|
0.0173
|
|
@TREND(1)
|
-0.015644
|
0.134818 -0.116039
|
0.9076
|
|
R-squared
|
0.395955
|
Mean dependent var
|
1.940640
|
|
Adjusted R-squared
|
0.387511
|
S.D. dependent var
|
2150.225
|
|
S.E. of regression
|
1682.802
|
Akaike info criterion
|
17.70879
|
|
Sum squared resid
|
3.44E+09
|
Schwarz criterion
|
17.78344
|
|
Log likelihood
|
-10908.32
|
Hannan-Quinn criter.
|
17.73687
|
|
F-statistic
|
46.88801
|
Durbin-Watson stat
|
1.998171
|
|
Prob(F-statistic)
|
0.000000
|
|
|
Null Hypothesis: D(SPTS) has a unit root
Exogenous: Constant, Linear Trend
Lag Length: 0 (Automatic based on Modified SIC, MAXLAG=22)
t-Statistic Prob.*
Augmented Dickey-Fuller test statistic -58.17555 0.0000
Test critical values: 1% level -3.965416
5% level -3.413416
10% level -3.128746
*MacKinnon (1996) one-sided p-values. Augmented Dickey-Fuller
Test Equation Dependent Variable: D(SPTS,2)
Method: Least Squares
Date: 05/30/11 Time: 11:36
Sample (adjusted): 3 1250
Included observations: 1250 after adjustments
|
Variable
|
Coefficient
|
Std. Error t-Statistic
|
Prob.
|
|
D(SPTS(-1))
|
-1.462133
|
0.025133 -58.17555
|
0.0000
|
|
C
|
7.108130
|
107.6266 0.066044
|
0.9474
|
|
@TREND(1)
|
-0.007065
|
0.149102 -0.047383
|
0.9622
|
|
R-squared
|
0.731066
|
Mean dependent var
|
0.008173
|
|
Adjusted R-squared
|
0.730634
|
S.D. dependent var
|
3656.309
|
|
S.E. of regression
|
1897.641
|
Akaike info criterion
|
17.93701
|
|
Sum squared resid
|
4.48E+09
|
Schwarz criterion
|
17.94934
|
|
Log likelihood
|
-11189.70
|
Hannan-Quinn criter.
|
17.94165
|
|
F-statistic
|
1692.197
|
Durbin-Watson stat
|
2.229257
|
|
Prob(F-statistic)
|
0.000000
|
|
|
|
=14J1de l' \le.
|
Japon (Au niveau et En différence)
Null Hypothesis: NIKKEI225 has a unit root
Exogenous: Constant, Linear Trend
Lag Length: 13 (Automatic based on Modified SIC, MAXLAG=22)
t-Statistic Prob.*
Augmented Dickey-Fuller test statistic -2.276598 0.4460
Test critical values: 1% level -3.965488
5% level -3.413451
10% level -3.128767
*MacKinnon (1996) one-sided p-values. Augmented Dickey-Fuller
Test Equation Dependent Variable: D(NIKKEI225)
Method: Least Squares
Date: 05/30/11 Time: 11:48
Sample (adjusted): 15 1250
Included observations: 1250 after adjustments
|
Variable
|
Coefficient
|
Std. Error t-Statistic
|
Prob.
|
|
C
|
681.0832
|
288.1342 2.363771
|
0.0182
|
|
@TREND(1)
|
-0.290507
|
0.155949 -1.862832
|
0.0627
|
|
R-squared
|
0.389351
|
Mean dependent var
|
-0.786707
|
|
Adjusted R-squared
|
0.381844
|
S.D. dependent var
|
2111.932
|
|
S.E. of regression
|
1660.463
|
Akaike info criterion
|
17.68044
|
|
Sum squared resid
|
3.36E+09
|
Schwarz criterion
|
17.74671
|
|
Log likelihood
|
-10910.51
|
Hannan-Quinn criter.
|
17.70537
|
|
F-statistic
|
51.85840
|
Durbin-Watson stat
|
2.010682
|
|
Prob(F-statistic)
|
0.000000
|
|
|
Null Hypothesis: D(NIKKEI225) has a unit root
Exogenous: Constant, Linear Trend
Lag Length: 0 (Automatic based on Modified SIC, MAXLAG=22)
t-Statistic Prob.*
Augmented Dickey-Fuller test statistic -59.21019 0.0000
Test critical values: 1% level -3.965416
5% level -3.413416
10% level -3.128746
*MacKinnon (1996) one-sided p-values. Augmented Dickey-Fuller
Test Equation Dependent Variable: D(NIKKEI225,2) Method: Least Squares
Date: 05/30/11 Time: 11:48
Sample (adjusted): 3 1250
Included observations: 1250 after adjustments
|
Variable
|
Coefficient
|
Std. Error t-Statistic
|
Prob.
|
|
D(NIKKEI225(-1))
|
-1.475883
|
0.024926 -59.21019
|
0.0000
|
|
C
|
11.45422
|
107.5707 0.106481
|
0.9152
|
|
@TREND(1)
|
-0.020487
|
0.149025 -0.137477
|
0.8907
|
|
R-squared
|
0.737941
|
Mean dependent var
|
0.128165
|
|
Adjusted R-squared
|
0.737520
|
S.D. dependent var
|
3702.033
|
|
S.E. of regression
|
1896.653
|
Akaike info criterion
|
17.93597
|
|
Sum squared resid
|
4.48E+09
|
Schwarz criterion
|
17.94830
|
|
Log likelihood
|
-11189.05
|
Hannan-Quinn criter.
|
17.94061
|
|
F-statistic
|
1752.924
|
Durbin-Watson stat
|
2.239170
|
|
Prob(F-statistic)
|
0.000000
|
|
|
Hong Kong (Au niveau et En différence)
Null Hypothesis: HANGSENG has a unit root
Exogenous: Constant, Linear Trend
Lag Length: 9 (Automatic based on Modified SIC, MAXLAG=22)
t-Statistic Prob.*
Augmented Dickey-Fuller test statistic -1.850196 0.6795
Test critical values: 1% level -3.965464
5% level -3.413440
10% level -3.128760
*MacKinnon (1996) one-sided p-values. Augmented Dickey-Fuller
Test Equation Dependent Variable: D(HANGSENG) Method: Least Squares
Date: 05/30/11 Time: 11:46
Sample (adjusted): 11 1250
Included observations: 1250 after adjustments
|
Variable
|
Coefficient
|
Std. Error
|
t-Statistic
|
Prob.
|
|
C
|
406.6069
|
213.7837
|
1.901955
|
0.0574
|
|
@TREND(1)
|
0.046825
|
0.141427
|
0.331092
|
0.7406
|
|
R-squared
|
0.328427
|
Mean dependent var
|
|
6.139226
|
|
Adjusted R-squared
|
0.322411
|
S.D. dependent var
|
|
2024.743
|
|
S.E. of regression
|
1666.683
|
Akaike info criterion
|
|
17.68469
|
|
Sum squared resid
|
3.41E+09
|
Schwarz criterion
|
|
17.73426
|
|
Log likelihood
|
-10952.51
|
Hannan-Quinn criter.
|
|
17.70333
|
|
F-statistic
|
54.59483
|
Durbin-Watson stat
|
|
1.999527
|
|
Prob(F-statistic)
|
0.000000
|
|
|
|
Null Hypothesis: D(HANGSENG) has a unit root
Exogenous: Constant, Linear Trend
Lag Length: 0 (Automatic based on Modified SIC, MAXLAG=22)
t-Statistic Prob.*
Augmented Dickey-Fuller test statistic -54.17722 0.0000
Test critical values: 1% level -3.965416
5% level -3.413416
10% level -3.128746
*MacKinnon (1996) one-sided p-values. Augmented Dickey-Fuller
Test Equation Dependent Variable: D(HANGSENG,2) Method: Least Squares
Date: 05/30/11 Time: 11:46
Sample (adjusted): 3 1250
Included observations: 1250 after adjustments
|
Variable
|
Coefficient
|
Std. Error t-Statistic
|
Prob.
|
|
D(HANGSENG(-1))
|
-1.404331
|
0.025921 -54.17722
|
0.0000
|
|
C
|
17.02203
|
104.7772 0.162459
|
0.8710
|
|
@TREND(1)
|
-0.014058
|
0.145154 -0.096848
|
0.9229
|
|
R-squared
|
0.702165
|
Mean dependent var
|
-0.027548
|
|
Adjusted R-squared
|
0.701687
|
S.D. dependent var
|
3382.387
|
|
S.E. of regression
|
1847.394
|
Akaike info criterion
|
17.88334
|
|
Sum squared resid
|
4.25E+09
|
Schwarz criterion
|
17.89567
|
|
Log likelihood
|
-11156.20
|
Hannan-Quinn criter.
|
17.88798
|
|
F-statistic
|
1467.585
|
Durbin-Watson stat
|
2.242268
|
|
Prob(F-statistic)
|
0.000000
|
|
|
|
=14J1de l' XV.raXie.
|
Australie (Au niveau et En différence)
Null Hypothesis: ALLORDINARIES has a unit root
Exogenous: Constant, Linear Trend
Lag Length: 21 (Automatic based on Modified SIC, MAXLAG=22)
t-Statistic Prob.*
Augmented Dickey-Fuller test statistic -1.467237 0.8403
Test critical values: 1% level -3.965537
5% level -3.413475
10% level -3.128781
*MacKinnon (1996) one-sided p-values. Augmented Dickey-Fuller
Test Equation Dependent Variable: D(ALLORDINARIES) Method: Least Squares
Date: 05/30/11 Time: 11:45
Sample (adjusted): 23 1250
Included observations: 1250 after adjustments
|
Variable
|
Coefficient
|
Std. Error t-Statistic
|
Prob.
|
|
C
|
74.73087
|
44.00287 1.698318
|
0.0897
|
|
@TREND(1)
|
-0.023159
|
0.019929 -1.162078
|
0.2454
|
|
R-squared
|
0.444970
|
Mean dependent var
|
0.583469
|
|
Adjusted R-squared
|
0.434367
|
S.D. dependent var
|
321.6468
|
|
S.E. of regression
|
241.9059
|
Akaike info criterion
|
13.83433
|
|
Sum squared resid
|
70456235
|
Schwarz criterion
|
13.93426
|
|
Log likelihood
|
-8470.276
|
Hannan-Quinn criter.
|
13.87193
|
|
F-statistic
|
41.96748
|
Durbin-Watson stat
|
2.008419
|
|
Prob(F-statistic)
|
0.000000
|
|
|
Null Hypothesis: D(ALLORDINARIES) has a unit root Exogenous:
Constant, Linear Trend
Lag Length: 0 (Automatic based on Modified SIC, MAXLAG=22)
t-Statistic Prob.*
Augmented Dickey-Fuller test statistic -59.63607 0.0001
Test critical values: 1% level -3.965416
5% level -3.413416
10% level -3.128746
*MacKinnon (1996) one-sided p-values. Augmented Dickey-Fuller
Test Equation Dependent Variable: D(ALLORDINARIES,2) Method: Least Squares
Date: 05/30/11 Time: 11:45
Sample (adjusted): 3 1250
Included observations: 1250 after adjustments
|
Variable
|
Coefficient
|
Std. Error t-Statistic
|
Prob.
|
|
D(ALLORDINARIES(-1))
|
-1.481406
|
0.024841 -59.63607
|
0.0000
|
|
C
|
3.840850
|
15.87432 0.241954
|
0.8089
|
|
@TREND(1)
|
-0.004965
|
0.021992 -0.225764
|
0.8214
|
|
R-squared
|
0.740704
|
Mean dependent var
|
-0.016106
|
|
Adjusted R-squared
|
0.740287
|
S.D. dependent var
|
549.2115
|
|
S.E. of regression
|
279.8892
|
Akaike info criterion
|
14.10907
|
|
Sum squared resid
|
97530790
|
Schwarz criterion
|
14.12140
|
|
Log likelihood
|
-8801.057
|
Hannan-Quinn criter.
|
14.11370
|
|
F-statistic
|
1778.230
|
Durbin-Watson stat
|
2.289054
|
|
Prob(F-statistic)
|
0.000000
|
|
|

Annexe 3 : Test de Ducky- Fuller simple pour les pays
émergents. =14J1de l' sie.
Chine (Au niveau et En différence)
Null Hypothesis: SHANGCOMP has a unit root
Exogenous: Constant, Linear Trend
Lag Length: 8 (Automatic based on Modified SIC, MAXLAG=22)
t-Statistic Prob.*
Augmented Dickey-Fuller test statistic -1.862654 0.6732
Test critical values: 1% level -3.965458
5% level -3.413437
10% level -3.128758
*MacKinnon (1996) one-sided p-values. Augmented Dickey-Fuller
Test Equation Dependent Variable: D(SHANGCOMP) Method: Least Squares
Date: 05/30/11 Time: 11:48
Sample (adjusted): 10 1250
Included observations: 1250 after adjustments
|
Variable
|
Coefficient
|
Std. Error
|
t-Statistic
|
Prob.
|
|
C
|
27.59611
|
17.76672
|
1.553247
|
0.1206
|
|
@TREND(1)
|
0.008979
|
0.021867
|
0.410618
|
0.6814
|
|
R-squared
|
0.095162
|
Mean dependent var
|
|
1.459919
|
|
Adjusted R-squared
|
0.087806
|
S.D. dependent var
|
|
261.9954
|
|
S.E. of regression
|
250.2288
|
Akaike info criterion
|
|
13.89145
|
|
Sum squared resid
|
77015803
|
Schwarz criterion
|
|
13.93687
|
|
Log likelihood
|
-8608.647
|
Hannan-Quinn criter.
|
|
13.90853
|
|
F-statistic
|
12.93594
|
Durbin-Watson stat
|
|
2.004366
|
|
Prob(F-statistic)
|
0.000000
|
|
|
|
106
Null Hypothesis: D(SHANGCOMP) has a unit root
Exogenous: Constant, Linear Trend
Lag Length: 0 (Automatic based on Modified SIC, MAXLAG=22)
t-Statistic Prob.*
Augmented Dickey-Fuller test statistic -42.84485 0.0000
Test critical values: 1% level -3.965416
5% level -3.413416
10% level -3.128746
*MacKinnon (1996) one-sided p-values. Augmented Dickey-Fuller
Test Equation Dependent Variable: D(SHANGCOMP,2) Method: Least Squares
Date: 05/30/11 Time: 11:49
Sample (adjusted): 3 1250
Included observations: 1250 after adjustments
|
Variable
|
Coefficient
|
Std. Error t-Statistic
|
Prob.
|
|
D(SHANGCOMP(-1))
|
-1.191745
|
0.027815 -42.84485
|
0.0000
|
|
C
|
4.418153
|
14.55463 0.303556
|
0.7615
|
|
@TREND(1)
|
-0.004428
|
0.020163 -0.219583
|
0.8262
|
|
R-squared
|
0.595869
|
Mean dependent var
|
-0.033197
|
|
Adjusted R-squared
|
0.595219
|
S.D. dependent var
|
403.3439
|
|
S.E. of regression
|
256.6170
|
Akaike info criterion
|
13.93545
|
|
Sum squared resid
|
81986068
|
Schwarz criterion
|
13.94778
|
|
Log likelihood
|
-8692.719
|
Hannan-Quinn criter.
|
13.94008
|
|
F-statistic
|
917.8407
|
Durbin-Watson stat
|
2.043789
|
|
Prob(F-statistic)
|
0.000000
|
|
|
Inde (Au niveau et En différence)
Null Hypothesis: BSE30 has a unit root
Exogenous: Constant, Linear Trend
Lag Length: 10 (Automatic based on Modified SIC, MAXLAG=22)
t-Statistic Prob.*
Augmented Dickey-Fuller test statistic -1.922157 0.6422
Test critical values: 1% level -3.965470
5% level -3.413442
10% level -3.128762
*MacKinnon (1996) one-sided p-values. Augmented Dickey-Fuller
Test Equation Dependent Variable: D(BSE30)
Method: Least Squares
Date: 05/30/11 Time: 11:46
Sample (adjusted): 12 1250
Included observations: 1250 after adjustments
|
Variable
|
Coefficient
|
Std. Error
|
t-Statistic
|
Prob.
|
|
C
|
386.7169
|
189.7420
|
2.038119
|
0.0418
|
|
@TREND(1)
|
0.126252
|
0.173709
|
0.726804
|
0.4675
|
|
R-squared
|
0.469041
|
Mean dependent var
|
|
8.715706
|
|
Adjusted R-squared
|
0.463844
|
S.D. dependent var
|
|
2485.619
|
|
S.E. of regression
|
1820.036
|
Akaike info criterion
|
|
17.86154
|
|
Sum squared resid
|
4.06E+09
|
Schwarz criterion
|
|
17.91528
|
|
Log likelihood
|
-11052.22
|
Hannan-Quinn criter.
|
|
17.88175
|
|
F-statistic
|
90.25262
|
Durbin-Watson stat
|
|
1.999471
|
|
Prob(F-statistic)
|
0.000000
|
|
|
|
Null Hypothesis: D(BSE30) has a unit root
Exogenous: Constant, Linear Trend
Lag Length: 0 (Automatic based on Modified SIC, MAXLAG=22)
t-Statistic Prob.*
Augmented Dickey-Fuller test statistic -60.47994 0.0001
Test critical values: 1% level -3.965416
5% level -3.413416
10% level -3.128746
*MacKinnon (1996) one-sided p-values. Augmented Dickey-Fuller
Test Equation Dependent Variable: D(BSE30,2)
Method: Least Squares
Date: 05/30/11 Time: 11:46
Sample (adjusted): 3 1250
Included observations: 1250 after adjustments
|
Variable
|
Coefficient
|
Std. Error t-Statistic
|
Prob.
|
|
D(BSE30(-1))
|
-1.492129
|
0.024671 -60.47994
|
0.0000
|
|
C
|
17.13955
|
122.3764 0.140056
|
0.8886
|
|
@TREND(1)
|
-0.007632
|
0.169535 -0.045017
|
0.9641
|
|
R-squared
|
0.746065
|
Mean dependent var
|
0.033934
|
|
Adjusted R-squared
|
0.745657
|
S.D. dependent var
|
4278.398
|
|
S.E. of regression
|
2157.701
|
Akaike info criterion
|
18.19388
|
|
Sum squared resid
|
5.80E+09
|
Schwarz criterion
|
18.20621
|
|
Log likelihood
|
-11349.98
|
Hannan-Quinn criter.
|
18.19851
|
|
F-statistic
|
1828.911
|
Durbin-Watson stat
|
2.316810
|
|
Prob(F-statistic)
|
0.000000
|
|
|
Indonésie (Au niveau et En
différence)
Null Hypothesis: JKSE has a unit root
Exogenous: Constant, Linear Trend
Lag Length: 14 (Automatic based on Modified SIC, MAXLAG=22)
t-Statistic Prob.*
Augmented Dickey-Fuller test statistic -2.013647 0.5927
Test critical values: 1% level -3.965494
5% level -3.413454
10% level -3.128769
*MacKinnon (1996) one-sided p-values. Augmented Dickey-Fuller
Test Equation Dependent Variable: D(JKSE)
Method: Least Squares
Date: 05/30/11 Time: 11:47
Sample (adjusted): 16 1250
Included observations: 1250 after adjustments
|
Variable
|
Coefficient
|
Std. Error
|
t-Statistic
|
Prob.
|
|
C
|
46.19886
|
25.05773
|
1.843697
|
0.0655
|
|
@TREND(1)
|
0.034505
|
0.026487
|
1.302719
|
0.1929
|
|
R-squared
|
0.347868
|
Mean dependent var
|
|
1.268267
|
|
Adjusted R-squared
|
0.339302
|
S.D. dependent var
|
|
315.9742
|
|
S.E. of regression
|
256.8344
|
Akaike info criterion
|
|
13.94841
|
|
Sum squared resid
|
80344012
|
Schwarz criterion
|
|
14.01887
|
|
Log likelihood
|
-8596.143
|
Hannan-Quinn criter.
|
|
13.97491
|
|
F-statistic
|
40.60757
|
Durbin-Watson stat
|
|
1.988491
|
|
Prob(F-statistic)
|
0.000000
|
|
|
|
Null Hypothesis: D(JKSE) has a unit root
Exogenous: Constant, Linear Trend
Lag Length: 0 (Automatic based on Modified SIC, MAXLAG=22)
t-Statistic Prob.*
Augmented Dickey-Fuller test statistic -56.17038 0.0000
Test critical values: 1% level -3.965416
5% level -3.413416
10% level -3.128746
*MacKinnon (1996) one-sided p-values. Augmented Dickey-Fuller
Test Equation Dependent Variable: D(JKSE,2)
Method: Least Squares
Date: 05/30/11 Time: 11:47
Sample (adjusted): 3 1250
Included observations: 1250 after adjustments
|
Variable
|
Coefficient
|
Std. Error t-Statistic
|
Prob.
|
|
D(JKSE(-1))
|
-1.429039
|
0.025441 -56.17038
|
0.0000
|
|
C
|
2.502160
|
16.09798 0.155433
|
0.8765
|
|
@TREND(1)
|
-0.000553
|
0.022301 -0.024777
|
0.9802
|
|
R-squared
|
0.717055
|
Mean dependent var
|
-0.908245
|
|
Adjusted R-squared
|
0.716600
|
S.D. dependent var
|
533.1589
|
|
S.E. of regression
|
283.8286
|
Akaike info criterion
|
14.13702
|
|
Sum squared resid
|
1.00E+08
|
Schwarz criterion
|
14.14935
|
|
Log likelihood
|
-8818.500
|
Hannan-Quinn criter.
|
14.14166
|
|
F-statistic
|
1577.574
|
Durbin-Watson stat
|
2.209962
|
|
Prob(F-statistic)
|
0.000000
|
|
|
Malaisie (Au niveau et En différence)
Null Hypothesis: KLSE has a unit root
Exogenous: Constant, Linear Trend
Lag Length: 14 (Automatic based on Modified SIC, MAXLAG=22)
t-Statistic Prob.*
Augmented Dickey-Fuller test statistic -1.698175 0.7518
Test critical values: 1% level -3.965494
5% level -3.413454
10% level -3.128769
*MacKinnon (1996) one-sided p-values. Augmented Dickey-Fuller
Test Equation Dependent Variable: D(KLSE)
Method: Least Squares
Date: 05/30/11 Time: 11:47
Sample (adjusted): 16 1250
Included observations: 1250 after adjustments
|
Variable
|
Coefficient
|
Std. Error
|
t-Statistic
|
Prob.
|
|
C
|
34.71808
|
20.15121
|
1.722878
|
0.0852
|
|
@TREND(1)
|
0.006475
|
0.010456
|
0.619253
|
0.5359
|
|
R-squared
|
0.456684
|
Mean dependent var
|
|
0.359490
|
|
Adjusted R-squared
|
0.449547
|
S.D. dependent var
|
|
161.9445
|
|
S.E. of regression
|
120.1507
|
Akaike info criterion
|
|
12.42904
|
|
Sum squared resid
|
17583285
|
Schwarz criterion
|
|
12.49950
|
|
Log likelihood
|
-7657.932
|
Hannan-Quinn criter.
|
|
12.45555
|
|
F-statistic
|
63.98687
|
Durbin-Watson stat
|
|
1.980349
|
|
Prob(F-statistic)
|
0.000000
|
|
|
|
Null Hypothesis: D(KLSE) has a unit root
Exogenous: Constant, Linear Trend
Lag Length: 0 (Automatic based on Modified SIC, MAXLAG=22)
t-Statistic Prob.*
Augmented Dickey-Fuller test statistic -59.87130 0.0001
Test critical values: 1% level -3.965416
5% level -3.413416
10% level -3.128746
*MacKinnon (1996) one-sided p-values. Augmented Dickey-Fuller
Test Equation Dependent Variable: D(KLSE,2)
Method: Least Squares
Date: 05/30/11 Time: 11:47
Sample (adjusted): 3 1250
Included observations: 1250 after adjustments
|
Variable
|
Coefficient
|
Std. Error t-Statistic
|
Prob.
|
|
D(KLSE(-1))
|
-1.484428
|
0.024794 -59.87130
|
0.0000
|
|
C
|
0.305564
|
7.999655 0.038197
|
0.9695
|
|
@TREND(1)
|
0.000297
|
0.011082 0.026778
|
0.9786
|
|
R-squared
|
0.742213
|
Mean dependent var
|
-0.008349
|
|
Adjusted R-squared
|
0.741799
|
S.D. dependent var
|
277.5792
|
|
S.E. of regression
|
141.0477
|
Akaike info criterion
|
12.73847
|
|
Sum squared resid
|
24768579
|
Schwarz criterion
|
12.75080
|
|
Log likelihood
|
-7945.808
|
Hannan-Quinn criter.
|
12.74311
|
|
F-statistic
|
1792.286
|
Durbin-Watson stat
|
2.314763
|
|
Prob(F-statistic)
|
0.000000
|
|
|
Corée (Au niveau et En
différence)
Null Hypothesis: KS11 has a unit root
Exogenous: Constant, Linear Trend
Lag Length: 9 (Automatic based on Modified SIC, MAXLAG=22)
t-Statistic Prob.*
Augmented Dickey-Fuller test statistic -2.054947 0.5699
Test critical values: 1% level -3.965464
5% level -3.413440
10% level -3.128760
*MacKinnon (1996) one-sided p-values. Augmented Dickey-Fuller
Test Equation Dependent Variable: D(KS11)
Method: Least Squares
Date: 05/30/11 Time: 11:48
Sample (adjusted): 11 1250
Included observations: 1250 after adjustments
|
Variable
|
Coefficient
|
Std. Error
|
t-Statistic
|
Prob.
|
|
C
|
49.51816
|
22.51641
|
2.199203
|
0.0280
|
|
@TREND(1)
|
0.004518
|
0.012941
|
0.349103
|
0.7271
|
|
R-squared
|
0.444393
|
Mean dependent var
|
|
0.569685
|
|
Adjusted R-squared
|
0.439416
|
S.D. dependent var
|
|
198.2979
|
|
S.E. of regression
|
148.4699
|
Akaike info criterion
|
|
12.84827
|
|
Sum squared resid
|
27069186
|
Schwarz criterion
|
|
12.89785
|
|
Log likelihood
|
-7953.929
|
Hannan-Quinn criter.
|
|
12.86692
|
|
F-statistic
|
89.29042
|
Durbin-Watson stat
|
|
2.001550
|
|
Prob(F-statistic)
|
0.000000
|
|
|
|
Null Hypothesis: D(KS11) has a unit root
Exogenous: Constant, Linear Trend
Lag Length: 0 (Automatic based on Modified SIC, MAXLAG=22)
t-Statistic Prob.*
Augmented Dickey-Fuller test statistic -60.64842 0.0001
Test critical values: 1% level -3.965416
5% level -3.413416
10% level -3.128746
*MacKinnon (1996) one-sided p-values. Augmented Dickey-Fuller
Test Equation Dependent Variable: D(KS11,2)
Method: Least Squares
Date: 05/30/11 Time: 11:48
Sample (adjusted): 3 1250
Included observations: 1250 after adjustments
|
Variable
|
Coefficient
|
Std. Error t-Statistic
|
Prob.
|
|
D(KS11(-1))
|
-1.494235
|
0.024638 -60.64842
|
0.0000
|
|
C
|
1.417299
|
9.753594 0.145310
|
0.8845
|
|
@TREND(1)
|
-0.001041
|
0.013512 -0.077027
|
0.9386
|
|
R-squared
|
0.747117
|
Mean dependent var
|
0.007388
|
|
Adjusted R-squared
|
0.746711
|
S.D. dependent var
|
341.7039
|
|
S.E. of regression
|
171.9722
|
Akaike info criterion
|
13.13494
|
|
Sum squared resid
|
36820155
|
Schwarz criterion
|
13.14727
|
|
Log likelihood
|
-8193.205
|
Hannan-Quinn criter.
|
13.13958
|
|
F-statistic
|
1839.115
|
Durbin-Watson stat
|
2.320236
|
|
Prob(F-statistic)
|
0.000000
|
|
|
Singapour (Au niveau et En différence)
Null Hypothesis: STI has a unit root
Exogenous: Constant, Linear Trend
Lag Length: 7 (Automatic based on Modified SIC, MAXLAG=22)
t-Statistic Prob.*
Augmented Dickey-Fuller test statistic -1.612052 0.7881
Test critical values: 1% level -3.965452
5% level -3.413434
10% level -3.128756
*MacKinnon (1996) one-sided p-values. Augmented Dickey-Fuller
Test Equation Dependent Variable: D(STI)
Method: Least Squares
Date: 05/30/11 Time: 11:49
Sample (adjusted): 9 1250
Included observations: 1250 after adjustments
|
Variable
|
Coefficient
|
Std. Error t-Statistic
|
Prob.
|
|
C
|
40.81677
|
24.63973 1.656543
|
0.0979
|
|
@TREND(1)
|
-0.002505
|
0.013262 -0.188918
|
0.8502
|
|
R-squared
|
0.377451
|
Mean dependent var
|
0.567593
|
|
Adjusted R-squared
|
0.372903
|
S.D. dependent var
|
211.2849
|
|
S.E. of regression
|
167.3154
|
Akaike info criterion
|
13.08566
|
|
Sum squared resid
|
34489158
|
Schwarz criterion
|
13.12692
|
|
Log likelihood
|
-8116.193
|
Hannan-Quinn criter.
|
13.10117
|
|
F-statistic
|
82.99555
|
Durbin-Watson stat
|
2.007061
|
|
Prob(F-statistic)
|
0.000000
|
|
|
Null Hypothesis: D(STI) has a unit root
Exogenous: Constant, Linear Trend
Lag Length: 0 (Automatic based on Modified SIC, MAXLAG=22)
t-Statistic Prob.*
Augmented Dickey-Fuller test statistic -60.36464 0.0001
Test critical values: 1% level -3.965416
5% level -3.413416
10% level -3.128746
*MacKinnon (1996) one-sided p-values. Augmented Dickey-Fuller
Test Equation Dependent Variable: D(STI,2)
Method: Least Squares
Date: 05/30/11 Time: 11:49
Sample (adjusted): 3 1250
Included observations: 1250 after adjustments
|
Variable
|
Coefficient
|
Std. Error t-Statistic
|
Prob.
|
|
D(STI(-1))
|
-1.490682
|
0.024695 -60.36464
|
0.0000
|
|
C
|
1.711690
|
10.42473 0.164195
|
0.8696
|
|
@TREND(1)
|
-0.001381
|
0.014442 -0.095630
|
0.9238
|
|
R-squared
|
0.745341
|
Mean dependent var
|
0.006322
|
|
Adjusted R-squared
|
0.744932
|
S.D. dependent var
|
363.9398
|
|
S.E. of regression
|
183.8051
|
Akaike info criterion
|
13.26803
|
|
Sum squared resid
|
42061493
|
Schwarz criterion
|
13.28036
|
|
Log likelihood
|
-8276.251
|
Hannan-Quinn criter.
|
13.27267
|
|
F-statistic
|
1821.945
|
Durbin-Watson stat
|
2.302288
|
|
Prob(F-statistic)
|
0.000000
|
|
|

=WHI l'AP pUIue latine.
Brésil (Au niveau et
En différence)
Null Hypothesis: BOVESPA has a unit root
Exogenous: Constant, Linear Trend
Lag Length: 15 (Automatic based on Modified SIC, MAXLAG=22)
t-Statistic Prob.*
Augmented Dickey-Fuller test statistic -1.544407 0.8139
Test critical values: 1% level -3.965500
5% level -3.413457
10% level -3.128770
*MacKinnon (1996) one-sided p-values. Augmented Dickey-Fuller
Test Equation Dependent Variable: D(BOVESPA)
Method: Least Squares
Date: 05/30/11 Time: 11:31
Sample (adjusted): 17 1250
Included observations: 1250 after adjustments
|
Variable
|
Coefficient
|
Std. Error
|
t-Statistic
|
Prob.
|
|
C
|
1155.162
|
716.1063
|
1.613115
|
0.1070
|
|
@TREND(1)
|
0.879554
|
0.734394
|
1.197660
|
0.2313
|
|
R-squared
|
0.425773
|
Mean dependent var
|
|
35.09157
|
|
Adjusted R-squared
|
0.417746
|
S.D. dependent var
|
|
8494.015
|
|
S.E. of regression
|
6481.409
|
Akaike info criterion
|
|
20.40574
|
|
Sum squared resid
|
5.11E+10
|
Schwarz criterion
|
|
20.48040
|
|
Log likelihood
|
-12572.34
|
Hannan-Quinn criter.
|
|
20.43383
|
|
F-statistic
|
53.03711
|
Durbin-Watson stat
|
|
1.985285
|
|
Prob(F-statistic)
|
0.000000
|
|
|
|
Null Hypothesis: D(BOVESPA) has a unit root
Exogenous: Constant, Linear Trend
Lag Length: 0 (Automatic based on Modified SIC, MAXLAG=22)
t-Statistic Prob.*
Augmented Dickey-Fuller test statistic -56.53415 0.0000
Test critical values: 1% level -3.965416
5% level -3.413416
10% level -3.128746
*MacKinnon (1996) one-sided p-values. Augmented Dickey-Fuller
Test Equation Dependent Variable: D(BOVESPA,2)
Method: Least Squares
Date: 05/30/11 Time: 11:31
Sample (adjusted): 3 1250
Included observations: 1250 after adjustments
|
Variable
|
Coefficient
|
Std. Error t-Statistic
|
Prob.
|
|
D(BOVESPA(-1))
|
-1.439331
|
0.025460 -56.53415
|
0.0000
|
|
C
|
30.36987
|
430.6823 0.070516
|
0.9438
|
|
@TREND(1)
|
0.027810
|
0.596651 0.046609
|
0.9628
|
|
R-squared
|
0.719665
|
Mean dependent var
|
-0.455128
|
|
Adjusted R-squared
|
0.719214
|
S.D. dependent var
|
14330.59
|
|
S.E. of regression
|
7593.664
|
Akaike info criterion
|
20.71042
|
|
Sum squared resid
|
7.18E+10
|
Schwarz criterion
|
20.72275
|
|
Log likelihood
|
-12920.30
|
Hannan-Quinn criter.
|
20.71505
|
|
F-statistic
|
1598.055
|
Durbin-Watson stat
|
2.270286
|
|
Prob(F-statistic)
|
0.000000
|
|
|
Mexique (Au niveau et En différence)
Null Hypothesis: IPC has a unit root
Exogenous: Constant, Linear Trend
Lag Length: 9 (Automatic based on Modified SIC, MAXLAG=22)
t-Statistic Prob.*
Augmented Dickey-Fuller test statistic -2.058490 0.5679
Test critical values: 1% level -3.965464
5% level -3.413440
10% level -3.128760
*MacKinnon (1996) one-sided p-values.
Augmented Dickey-Fuller Test Equation
Dependent Variable: D(IPC) Method: Least Squares
Date: 05/30/11 Time: 11:32 Sample (adjusted): 11 1250 Included
observations: 1250 after adjustments
|
Variable
|
Coefficient
|
Std. Error
|
t-Statistic
|
Prob.
|
|
C
|
644.0286
|
259.1141
|
2.485502
|
0.0131
|
|
@TREND(1)
|
0.153498
|
0.221016
|
0.694510
|
0.4875
|
|
R-squared
|
0.435315
|
Mean dependent var
|
|
26.27262
|
|
Adjusted R-squared
|
0.430257
|
S.D. dependent var
|
|
2890.722
|
|
S.E. of regression
|
2181.955
|
Akaike info criterion
|
|
18.22346
|
|
Sum squared resid
|
5.85E+09
|
Schwarz criterion
|
|
18.27304
|
|
Log likelihood
|
-11286.55
|
Hannan-Quinn criter.
|
|
18.24211
|
|
F-statistic
|
86.06039
|
Durbin-Watson stat
|
|
1.991266
|
|
Prob(F-statistic)
|
0.000000
|
|
|
|
Null Hypothesis: D(IPC) has a unit root
Exogenous: Constant, Linear Trend
Lag Length: 0 (Automatic based on Modified SIC, MAXLAG=22)
t-Statistic Prob.*
Augmented Dickey-Fuller test statistic -60.19589 0.0001
Test critical values: 1% level -3.965416
5% level -3.413416
10% level -3.128746
*MacKinnon (1996) one-sided p-values. Augmented Dickey-Fuller
Test Equation Dependent Variable: D(IPC,2)
Method: Least Squares
Date: 05/30/11 Time: 11:32
Sample (adjusted): 3 1250
Included observations: 1250 after adjustments
|
Variable
|
Coefficient
|
Std. Error t-Statistic
|
Prob.
|
|
D(IPC(-1))
|
-1.488549
|
0.024728 -60.19589
|
0.0000
|
|
C
|
30.13728
|
146.1662 0.206185
|
0.8367
|
|
@TREND(1)
|
-0.011471
|
0.202492 -0.056651
|
0.9548
|
|
R-squared
|
0.744277
|
Mean dependent var
|
0.215481
|
|
Adjusted R-squared
|
0.743866
|
S.D. dependent var
|
5092.203
|
|
S.E. of regression
|
2577.148
|
Akaike info criterion
|
18.54916
|
|
Sum squared resid
|
8.27E+09
|
Schwarz criterion
|
18.56149
|
|
Log likelihood
|
-11571.67
|
Hannan-Quinn criter.
|
18.55379
|
|
F-statistic
|
1811.773
|
Durbin-Watson stat
|
2.335918
|
|
Prob(F-statistic)
|
0.000000
|
|
|
Argentine (Au niveau et En différence)
Null Hypothesis: MERVAL has a unit root
Exogenous: Constant, Linear Trend
Lag Length: 11 (Automatic based on Modified SIC, MAXLAG=22)
t-Statistic Prob.*
Augmented Dickey-Fuller test statistic -1.961026 0.6214
Test critical values: 1% level -3.965476
5% level -3.413445
10% level -3.128763
*MacKinnon (1996) one-sided p-values. Augmented Dickey-Fuller
Test Equation Dependent Variable: D(MERVAL)
Method: Least Squares
Date: 05/30/11 Time: 11:32
Sample (adjusted): 13 1250
Included observations: 1250 after adjustments
|
Variable
|
Coefficient
|
Std. Error
|
t-Statistic
|
Prob.
|
|
C
|
61.68896
|
31.73533
|
1.943858
|
0.0521
|
|
@TREND(1)
|
0.003945
|
0.018111
|
0.217839
|
0.8276
|
|
R-squared
|
0.422839
|
Mean dependent var
|
|
0.774515
|
|
Adjusted R-squared
|
0.416709
|
S.D. dependent var
|
|
296.1339
|
|
S.E. of regression
|
226.1677
|
Akaike info criterion
|
|
13.69167
|
|
Sum squared resid
|
62609846
|
Schwarz criterion
|
|
13.74959
|
|
Log likelihood
|
-8461.147
|
Hannan-Quinn criter.
|
|
13.71346
|
|
F-statistic
|
68.97900
|
Durbin-Watson stat
|
|
2.007269
|
|
Prob(F-statistic)
|
0.000000
|
|
|
|
Null Hypothesis: D(MERVAL) has a unit root
Exogenous: Constant, Linear Trend
Lag Length: 0 (Automatic based on Modified SIC, MAXLAG=22)
t-Statistic Prob.*
Augmented Dickey-Fuller test statistic -58.93437 0.0000
Test critical values: 1% level -3.965416
5% level -3.413416
10% level -3.128746
*MacKinnon (1996) one-sided p-values. Augmented Dickey-Fuller
Test Equation Dependent Variable: D(MERVAL,2)
Method: Least Squares
Date: 05/30/11 Time: 11:32
Sample (adjusted): 3 1250
Included observations: 1250 after adjustments
|
Variable
|
Coefficient
|
Std. Error t-Statistic
|
Prob.
|
|
D(MERVAL(-1))
|
-1.472249
|
0.024981 -58.93437
|
0.0000
|
|
C
|
0.365839
|
15.00572 0.024380
|
0.9806
|
|
@TREND(1)
|
0.001219
|
0.020788 0.058650
|
0.9532
|
|
R-squared
|
0.736132
|
Mean dependent var
|
0.071210
|
|
Adjusted R-squared
|
0.735708
|
S.D. dependent var
|
514.6466
|
|
S.E. of regression
|
264.5766
|
Akaike info criterion
|
13.99654
|
|
Sum squared resid
|
87150962
|
Schwarz criterion
|
14.00887
|
|
Log likelihood
|
-8730.841
|
Hannan-Quinn criter.
|
14.00118
|
|
F-statistic
|
1736.630
|
Durbin-Watson stat
|
2.299443
|
|
Prob(F-statistic)
|
0.000000
|
|
|

=14J1de l' IriTXIT
Tunisie (Au niveau et En différence)
Null Hypothesis: TUNINDEX has a unit root
Exogenous: Constant, Linear Trend
Lag Length: 22 (Automatic based on Modified SIC, MAXLAG=22)
t-Statistic Prob.*
Augmented Dickey-Fuller test statistic -2.335111 0.4139
Test critical values: 1% level -3.965693
5% level -3.413552
10% level -3.128826
*MacKinnon (1996) one-sided p-values. Augmented Dickey-Fuller
Test Equation Dependent Variable: D(TUNINDEX)
Method: Least Squares
Date: 05/30/11 Time: 11:51
Sample (adjusted): 24 1250
Included observations: 1250 after adjustments
|
Variable
|
Coefficient
|
Std. Error
|
t-Statistic
|
Prob.
|
|
C
|
127.6034
|
56.27143
|
2.267641
|
0.0235
|
|
@TREND(1)
|
0.238132
|
0.092467
|
2.575327
|
0.0101
|
|
R-squared
|
0.379909
|
Mean dependent var
|
|
2.507024
|
|
Adjusted R-squared
|
0.367275
|
S.D. dependent var
|
|
383.5347
|
|
S.E. of regression
|
305.0789
|
Akaike info criterion
|
|
14.29958
|
|
Sum squared resid
|
1.10E+08
|
Schwarz criterion
|
|
14.40541
|
|
Log likelihood
|
-8576.198
|
Hannan-Quinn criter.
|
|
14.33944
|
|
F-statistic
|
30.07167
|
Durbin-Watson stat
|
|
2.000385
|
|
Prob(F-statistic)
|
0.000000
|
|
|
|
Null Hypothesis: D(TUNINDEX) has a unit root
Exogenous: Constant, Linear Trend
Lag Length: 0 (Automatic based on Modified SIC, MAXLAG=22)
t-Statistic Prob.*
Augmented Dickey-Fuller test statistic -49.65332 0.0000
Test critical values: 1% level -3.965434
5% level -3.413425
10% level -3.128751
*MacKinnon (1996) one-sided p-values. Augmented Dickey-Fuller
Test Equation Dependent Variable: D(TUNINDEX,2) Method: Least Squares
Date: 05/30/11 Time: 11:52
Sample (adjusted): 3 1250
Included observations: 1250 after adjustments
|
Variable
|
Coefficient
|
Std. Error t-Statistic
|
Prob.
|
|
D(TUNINDEX(-1))
|
-1.329997
|
0.026786 -49.65332
|
0.0000
|
|
C
|
1.027881
|
22.37258 0.045944
|
0.9634
|
|
@TREND(1)
|
0.004084
|
0.031056 0.131489
|
0.8954
|
|
R-squared
|
0.664999
|
Mean dependent var
|
0.023671
|
|
Adjusted R-squared
|
0.664460
|
S.D. dependent var
|
680.4216
|
|
S.E. of regression
|
394.1400
|
Akaike info criterion
|
14.79370
|
|
Sum squared resid
|
1.93E+08
|
Schwarz criterion
|
14.80605
|
|
Log likelihood
|
-9206.076
|
Hannan-Quinn criter.
|
14.79834
|
|
F-statistic
|
1232.726
|
Durbin-Watson stat
|
2.199634
|
|
Prob(F-statistic)
|
0.000000
|
|
|
Egypte (Au niveau et En différence)
Null Hypothesis: EGX30 has a unit root
Exogenous: Constant, Linear Trend
Lag Length: 4 (Automatic based on Modified SIC, MAXLAG=22)
t-Statistic Prob.*
Augmented Dickey-Fuller test statistic -1.449064 0.8461
Test critical values: 1% level -3.965434
5% level -3.413425
10% level -3.128751
*MacKinnon (1996) one-sided p-values. Augmented Dickey-Fuller
Test Equation Dependent Variable: D(EGX30)
Method: Least Squares
Date: 05/30/11 Time: 11:51
Sample (adjusted): 6 1250
Included observations: 1250 after adjustments
|
Variable
|
Coefficient
|
Std. Error t-Statistic
|
Prob.
|
|
C
|
40.40381
|
18.90378 2.137340
|
0.0328
|
|
@TREND(1)
|
-0.011852
|
0.018759 -0.631801
|
0.5276
|
|
R-squared
|
0.112462
|
Mean dependent var
|
3.179462
|
|
Adjusted R-squared
|
0.108161
|
S.D. dependent var
|
226.2490
|
|
S.E. of regression
|
213.6633
|
Akaike info criterion
|
13.57229
|
|
Sum squared resid
|
56517208
|
Schwarz criterion
|
13.60111
|
|
Log likelihood
|
-8441.749
|
Hannan-Quinn criter.
|
13.58313
|
|
F-statistic
|
26.14504
|
Durbin-Watson stat
|
1.988037
|
|
Prob(F-statistic)
|
0.000000
|
|
|
Null Hypothesis: D(EGX30) has a unit root
Exogenous: Constant, Linear Trend
Lag Length: 0 (Automatic based on Modified SIC, MAXLAG=22)
t-Statistic Prob.*
Augmented Dickey-Fuller test statistic -34.81357 0.0000
Test critical values: 1% level -3.965416
5% level -3.413416
10% level -3.128746
*MacKinnon (1996) one-sided p-values. Augmented Dickey-Fuller
Test Equation Dependent Variable: D(EGX30,2)
Method: Least Squares
Date: 05/30/11 Time: 11:51
Sample (adjusted): 3 1250
Included observations: 1250 after adjustments
|
Variable
|
Coefficient
|
Std. Error t-Statistic
|
Prob.
|
|
D(EGX30(-1))
|
-0.987878
|
0.028376 -34.81357
|
0.0000
|
|
C
|
13.96180
|
12.82819 1.088369
|
0.2766
|
|
@TREND(1)
|
-0.017236
|
0.017769 -0.969978
|
0.3322
|
|
R-squared
|
0.493283
|
Mean dependent var
|
-0.338117
|
|
Adjusted R-squared
|
0.492469
|
S.D. dependent var
|
317.3484
|
|
S.E. of regression
|
226.0828
|
Akaike info criterion
|
13.68208
|
|
Sum squared resid
|
63636233
|
Schwarz criterion
|
13.69441
|
|
Log likelihood
|
-8534.618
|
Hannan-Quinn criter.
|
13.68672
|
|
F-statistic
|
605.9964
|
Durbin-Watson stat
|
1.989895
|
|
Prob(F-statistic)
|
0.000000
|
|
|
|
Zone de l'Europe
|
Belgique (Au niveau et En différence)
Null Hypothesis: BEL20 has a unit root
Exogenous: Constant, Linear Trend
Lag Length: 0 (Automatic based on Modified SIC, MAXLAG=22)
t-Statistic Prob.*
Augmented Dickey-Fuller test statistic -1.562716 0.8071
Test critical values: 1% level -3.965410
5% level -3.413413
10% level -3.128744
*MacKinnon (1996) one-sided p-values. Augmented Dickey-Fuller
Test Equation Dependent Variable: D(BEL20)
Method: Least Squares
Date: 05/30/11 Time: 11:40
Sample (adjusted): 2 1250
Included observations: 1250 after adjustments
|
Variable
|
Coefficient
|
Std. Error t-Statistic
|
Prob.
|
|
BEL20(-1)
|
-0.002561
|
0.001639 -1.562716
|
0.1184
|
|
C
|
12.59213
|
7.271996 1.731592
|
0.0836
|
|
@TREND(1)
|
-0.007121
|
0.004008 -1.776428
|
0.0759
|
|
R-squared
|
0.002892
|
Mean dependent var
|
-0.379271
|
|
Adjusted R-squared
|
0.001291
|
S.D. dependent var
|
42.14806
|
|
S.E. of regression
|
42.12084
|
Akaike info criterion
|
10.32136
|
|
Sum squared resid
|
2210610.
|
Schwarz criterion
|
10.33368
|
|
Log likelihood
|
-6442.690
|
Hannan-Quinn criter.
|
10.32599
|
|
F-statistic
|
1.806707
|
Durbin-Watson stat
|
1.972537
|
|
Prob(F-statistic)
|
0.164624
|
|
|
Null Hypothesis: D(BEL20) has a unit root
Exogenous: Constant, Linear Trend
Lag Length: 21 (Automatic based on Modified SIC, MAXLAG=22)
t-Statistic Prob.*
Augmented Dickey-Fuller test statistic -6.540594 0.0000
Test critical values: 1% level -3.965543
5% level -3.413478
10% level -3.128783
*MacKinnon (1996) one-sided p-values. Augmented Dickey-Fuller
Test Equation Dependent Variable: D(BEL20,2)
Method: Least Squares
Date: 05/30/11 Time: 11:40
Sample (adjusted): 24 1250
Included observations: 1250 after adjustments
|
Variable
|
Coefficient
|
Std. Error t-Statistic
|
Prob.
|
|
C
|
1.357337
|
2.497141 0.543557
|
0.5868
|
|
@TREND(1)
|
-0.002682
|
0.003448 -0.777831
|
0.4368
|
|
R-squared
|
0.504682
|
Mean dependent var
|
0.031410
|
|
Adjusted R-squared
|
0.495212
|
S.D. dependent var
|
59.57730
|
|
S.E. of regression
|
42.32875
|
Akaike info criterion
|
10.34818
|
|
Sum squared resid
|
2155443.
|
Schwarz criterion
|
10.44817
|
|
Log likelihood
|
-6324.606
|
Hannan-Quinn criter.
|
10.38580
|
|
F-statistic
|
53.29309
|
Durbin-Watson stat
|
1.998207
|
|
Prob(F-statistic)
|
0.000000
|
|
|
Annexe 4 : Test de Co-intégration

Détermination du nombre de retard
L'Afrique
|
VAR 1
|
VAR 2
|
VAR 3
|
VAR 4
|
|
AIC
|
28.522
|
28.447
|
28.279
|
28.245
|
|
SC
|
28.547
|
28.488
|
28.336
|
28.319
|
Co-intégration
Date: 05/30/11 Time: 12:08
Sample (adjusted): 5 1250
Included observations: 1250 after adjustments Trend
assumption: Linear deterministic trend Series: TUNINDEX EGX30
Lags interval (in first differences): 1 to 3
Unrestricted Cointegration Rank Test (Trace)
Hypothesized Trace 0.05
No. of CE(s) Eigenvalue Statistic Critical Value Prob.**
None * 0.010609 17.06710 15.49471 0.0288
At most 1 0.003083 3.831361 3.841466 0.0503
Trace test indicates 1 cointegrating eqn(s) at the 0.05 level *
denotes rejection of the hypothesis at the 0.05 level **MacKinnon-Haug-Michelis
(1999) p-values
Unrestricted Cointegration Rank Test (Maximum Eigenvalue)
Hypothesized Max-Eigen 0.05
No. of CE(s) Eigenvalue Statistic Critical Value Prob.**
None 0.010609 13.23574 14.26460 0.0722
At most 1 0.003083 3.831361 3.841466 0.0503
130
Max-eigenvalue test indicates no cointegration at the 0.05 level
* denotes rejection of the hypothesis at the 0.05 level
**MacKinnon-Haug-Michelis (1999) p-values
Unrestricted Cointegrating Coefficients (normalized by
b'*S11*b=I):
TUNINDEX EGX30
-0.001294 0.000120
0.000111 -0.000451
Unrestricted Adjustment Coefficients (alpha):
D(TUNINDEX) 37.78661 -0.856175
D(EGX30) 1.115461 11.92958
1 Cointegrating Equation(s): Log likelihood -17510.11
Normalized cointegrating coefficients (standard error in
parentheses)
TUNINDEX EGX30
1.000000 -0.092706
(0.09328)
Adjustment coefficients (standard error in parentheses)
D(TUNINDEX) -0.048887
(0.01346)
D(EGX30) -0.001443
(0.00793)
VECM
Vector Error Correction Estimates
Date: 05/30/11 Time: 12:10
Sample (adjusted): 5 1250
Included observations: 1250 after adjustments Standard errors in
( ) & t-statistics in [ ]
|
Cointegrating Eq:
|
CointEq1
|
|
|
TUNINDEX(-1)
|
1.000000
|
|
|
EGX30(-1)
|
-0.092706
|
|
|
(0.09328)
|
|
|
[-0.99387]
|
|
|
C
|
-1999.875
|
|
|
Error Correction:
|
D(TUNINDEX)
|
D(EGX30)
|
|
CointEq1
|
-0.048887
|
-0.001443
|
|
(0.01346)
|
(0.00793)
|
|
[-3.63280]
|
[-0.18206]
|
|
D(TUNINDEX(-1))
|
-0.458310
|
0.004906
|
|
(0.02934)
|
(0.01728)
|
|
[-15.6209]
|
[ 0.28388]
|
D(TUNINDEX(-2)) -0.367095 0.008873
(0.02976) (0.01753)
[-12.3342] [ 0.50612]
D(TUNINDEX(-3)) -0.201106 0.004213
(0.02796) (0.01647)
[-7.19282] [ 0.25584]
D(EGX30(-1)) 0.035288 0.027945
(0.04840) (0.02851)
[ 0.72911] [ 0.98023]
D(EGX30(-2)) 0.008266 -0.310527
(0.04613) (0.02717)
[ 0.17917] [-11.4271]
D(EGX30(-3)) 0.000116 0.037777
(0.04850) (0.02857)
[ 0.00238] [ 1.32244]
|
C 5.306338
(10.4074)
|
3.904617
(6.13027)
|
|
[ 0.50986]
|
[ 0.63694]
|
|
R-squared 0.235406
|
0.096835
|
|
Adj. R-squared 0.231066
|
0.091708
|
|
Sum sq. resids 1.66E+08
|
57438218
|
|
S.E. equation 366.4228
|
215.8335
|
|
F-statistic 54.23165
|
18.88560
|
|
Log likelihood -9083.490
|
-8426.654
|
|
Akaike AIC 14.65188
|
13.59332
|
|
Schwarz SC 14.68491
|
13.62635
|
|
Mean dependent 2.692554
|
3.046640
|
|
S.D. dependent 417.8668
|
226.4676
|
|
Determinant resid covariance (dof adj.)
|
6.25E+09
|
|
Determinant resid covariance
|
6.17E+09
|
|
Log likelihood
|
-17510.11
|
|
Akaike information criterion
|
28.24836
|
|
Schwarz criterion
|
28.32267
|
CausalitéPairwise Granger
Causality Tests
Date: 05/30/11 Time: 12:14 Sample: 1 1250
Lags: 2
Null Hypothesis: Obs F-Statistic Prob.
LNEGX30 does not Granger Cause TUNDEX 1195 0.35261 0.7029
TUNDEX does not Granger Cause LNEGX30 0.26659 0.7660
L'Europe

|
VAR 1
|
VAR 2
|
VAR 3
|
VAR 4
|
|
AIC
|
84.418
|
83.89
|
83.63
|
84.328
|
|
SC
|
84.648
|
84.328
|
84.269
|
84.164
|
Co-integration
Date: 05/30/11 Time: 12:21
Sample (adjusted): 5 1250
Included observations: 1250 after adjustments
Trend assumption: Linear deterministic trend
Series: AEX BEL20 CAC40 DAX FTSE100 MIB30 SSMI Lags interval (in
first differences): 1 to 3
Unrestricted Cointegration Rank Test (Trace)
|
Hypothesized
|
|
Trace
|
0.05
|
|
|
No. of CE(s)
|
Eigenvalue
|
Statistic
|
Critical Value
|
Prob.**
|
|
None *
|
0.164028
|
481.9300
|
125.6154
|
0.0001
|
|
At most 1 *
|
0.105691
|
258.6972
|
95.75366
|
0.0000
|
|
At most 2 *
|
0.051739
|
119.5148
|
69.81889
|
0.0000
|
|
|
|
|
|
At most 3 * 0.028793 53.32009 47.85613
|
0.0141
|
|
|
|
At most 4 0.007990 16.91762 29.79707
|
0.6461
|
|
|
|
At most 5 0.005310 6.921606 15.49471
|
0.5868
|
|
|
|
At most 6 0.000231 0.287433 3.841466
|
0.5919
|
|
|
|
Trace test indicates 4 cointegrating eqn(s) at the 0.05 level
|
|
|
|
|
* denotes rejection of the hypothesis at the 0.05 level
|
|
|
|
|
**MacKinnon-Haug-Michelis (1999) p-values
|
|
|
|
|
Unrestricted Cointegration Rank Test (Maximum Eigenvalue)
|
|
|
|
|
Hypothesized Max-Eigen 0.05
No. of CE(s) Eigenvalue Statistic Critical Value
|
Prob.**
|
|
|
|
None * 0.164028 223.2328 46.23142
|
0.0000
|
|
|
|
At most 1 * 0.105691 139.1824 40.07757
|
0.0001
|
|
|
|
At most 2 * 0.051739 66.19468 33.87687
|
0.0000
|
|
|
|
At most 3 * 0.028793 36.40247 27.58434
|
0.0029
|
|
|
|
At most 4 0.007990 9.996014 21.13162
|
0.7451
|
|
|
|
At most 5 0.005310 6.634173 14.26460
|
0.5333
|
|
|
|
At most 6 0.000231 0.287433 3.841466
|
0.5919
|
|
|
|
Max-eigenvalue test indicates 4 cointegrating eqn(s) at the 0.05
level
|
|
|
|
|
* denotes rejection of the hypothesis at the 0.05 level
|
|
|
|
|
**MacKinnon-Haug-Michelis (1999) p-values
|
|
|
|
|
Unrestricted Cointegrating Coefficients (normalized by
b'*S11*b=I):
|
|
|
|
|
AEX BEL20 CAC40 DAX
|
FTSE100
|
MIB30
|
SSMI
|
|
0.034568
|
-0.000769
|
-0.000404
|
0.000212
|
-0.004491
|
-8.35E-05
|
0.001268
|
|
-0.007753
|
-0.000220
|
0.011351
|
-0.001289
|
-0.000295
|
-0.000628
|
-0.002328
|
|
0.021450
|
0.003925
|
-0.004807
|
-0.001709
|
0.000575
|
-0.000409
|
0.002591
|
|
-0.040584
|
0.010464
|
-0.003706
|
0.000933
|
-0.000365
|
-0.000121
|
-0.001267
|
|
-0.072717
|
0.001981
|
0.005398
|
0.000509
|
-2.67E-05
|
-5.53E-05
|
0.000418
|
|
-0.027666
|
-0.001601
|
0.003155
|
-0.000900
|
-4.89E-05
|
0.000232
|
-7.66E-05
|
|
0.005651
|
0.000136
|
-0.000372
|
-0.000217
|
-7.14E-05
|
0.000113
|
-3.23E-05
|
Unrestricted Adjustment Coefficients (alpha):
D(AEX) 0.023321 -0.096130 0.455220 0.611344 0.034319 0.235723
0.011370
D(BEL20) 0.729314 0.201091 2.118592 -0.814212 -0.869777 2.724958
-0.077413
D(CAC40) 1.258077 -1.711614 6.453219 7.176462 -1.277136 2.190449
0.114149
D(DAX) 2.895387 58.92608 27.07687 -6.041505 0.194546 -0.649005
1.155793
D(FTSE100) 152.5412 18.68268 -23.50317 11.07254 -0.178076
3.241806 -0.043924
D(MIB30) 2.990069 275.1332 133.9618 -6.465772 10.05649 -7.144862
-4.690851
D(SSMI) -39.72783 44.46723 -35.06098 18.60810 -8.209885 4.514054
-0.088367
1 Cointegrating Equation(s): Log likelihood -51840.25
Normalized cointegrating coefficients (standard error in
parentheses)
AEX BEL20 CAC40 DAX FTSE100 MIB30 SSMI
1.000000 -0.022232 -0.011678 0.006143 -0.129930 -0.002417
0.036681
(0.01952) (0.02468) (0.00461) (0.00817) (0.00151) (0.00685)
Adjustment coefficients (standard error in parentheses)
D(AEX) 0.000806
(0.00525)
D(BEL20) 0.025211
(0.03993)
D(CAC40) 0.043489
(0.06088)
D(DAX) 0.100088
(0.23014)
D(FTSE100) 5.273059
(0.36829)
D(MIB30) 0.103361
(1.07477)
D(SSMI) -1.373316
(0.27042)
136
2 Cointegrating Equation(s): Log likelihood -51770.66
Normalized cointegrating coefficients (standard error in
parentheses)
|
AEX
|
BEL20
|
CAC40
|
DAX
|
FTSE100
|
MIB30
|
SSMI
|
|
1.000000
|
0.000000
|
-0.649325
|
0.076453
|
-0.056158
|
0.034232
|
0.152423
|
|
|
(0.05177)
|
(0.01187)
|
(0.02102)
|
(0.00358)
|
(0.01758)
|
|
0.000000
|
1.000000
|
-28.68091
|
3.162474
|
3.318224
|
1.648457
|
5.205995
|
|
|
(2.30712)
|
(0.52886)
|
(0.93683)
|
(0.15967)
|
(0.78342)
|
|
Adjustment coefficients (standard error in parentheses)
|
|
|
|
|
|
D(AEX)
|
0.001551
|
3.25E-06
|
|
|
|
|
|
(0.00538)
|
(0.00012)
|
|
|
|
|
|
D(BEL20)
|
0.023652
|
-0.000605
|
|
|
|
|
|
(0.04092)
|
(0.00092)
|
|
|
|
|
|
D(CAC40)
|
0.056759
|
-0.000590
|
|
|
|
|
|
(0.06237)
|
(0.00141)
|
|
|
|
|
|
D(DAX)
|
-0.356750
|
-0.015204
|
|
|
|
|
|
(0.22818)
|
(0.00515)
|
|
|
|
|
|
D(FTSE100)
|
5.128217
|
-0.121348
|
|
|
|
|
|
(0.37696)
|
(0.00851)
|
|
|
|
|
|
D(MIB30)
|
-2.029675
|
-0.062899
|
|
|
|
|
|
(1.06562)
|
(0.02405)
|
|
|
|
|
|
D(SSMI)
|
-1.718058
|
0.020738
|
|
|
|
|
|
(0.27345)
|
(0.00617)
|
|
|
|
|
|
3 Cointegrating Equation(s):
|
Log likelihood
|
-51737.56
|
|
|
|
|
Normalized cointegrating coefficients (standard error in
parentheses)
|
|
|
|
|
AEX
|
BEL20
|
CAC40
|
DAX
|
FTSE100
|
MIB30
|
SSMI
|
|
1.000000
|
0.000000
|
0.000000
|
-0.007651
|
-0.116156
|
-0.006389
|
0.039775
|
|
|
|
(0.00399)
|
(0.00769)
|
(0.00067)
|
(0.00560)
|
|
0.000000
|
1.000000
|
0.000000
|
-0.552417
|
0.668088
|
-0.145809
|
0.230287
|
|
|
|
(0.06727)
|
(0.12951)
|
(0.01126)
|
(0.09424)
|
|
0.000000
|
0.000000
|
1.000000
|
-0.129525
|
-0.092401
|
-0.062560
|
-0.173485
|
|
|
|
|
|
|
|
|
|
|
(0.01692)
|
(0.03257)
|
(0.00283)
|
(0.02370)
|
|
Adjustment coefficients (standard error in parentheses)
|
|
|
|
|
|
D(AEX)
|
0.011316
|
0.001790
|
-0.003289
|
|
|
|
|
(0.00627)
|
(0.00061)
|
(0.00187)
|
|
|
|
|
D(BEL20)
|
0.069097
|
0.007710
|
-0.008196
|
|
|
|
|
(0.04777)
|
(0.00462)
|
(0.01423)
|
|
|
|
|
D(CAC40)
|
0.195184
|
0.024736
|
-0.050958
|
|
|
|
|
(0.07251)
|
(0.00701)
|
(0.02159)
|
|
|
|
|
D(DAX)
|
0.224061
|
0.091062
|
0.537560
|
|
|
|
|
(0.26482)
|
(0.02561)
|
(0.07887)
|
|
|
|
|
D(FTSE100)
|
4.624063
|
-0.213589
|
0.263477
|
|
|
|
|
(0.43980)
|
(0.04253)
|
(0.13098)
|
|
|
|
|
D(MIB30)
|
0.843868
|
0.462847
|
2.477955
|
|
|
|
|
(1.23559)
|
(0.11949)
|
(0.36798)
|
|
|
|
|
D(SSMI)
|
-2.470133
|
-0.116863
|
0.689341
|
|
|
|
|
(0.31697)
|
(0.03065)
|
(0.09440)
|
|
|
|
|
4 Cointegrating Equation(s):
|
Log likelihood
|
-51719.36
|
|
|
|
|
Normalized cointegrating coefficients (standard error in
parentheses)
|
|
|
|
|
AEX
|
BEL20
|
CAC40
|
DAX
|
FTSE100
|
MIB30
|
SSMI
|
|
1.000000
|
0.000000
|
0.000000
|
0.000000
|
-0.132189
|
-0.005210
|
0.036280
|
|
|
|
|
(0.00726)
|
(0.00061)
|
(0.00508)
|
|
0.000000
|
1.000000
|
0.000000
|
0.000000
|
-0.489538
|
-0.060646
|
-0.022055
|
|
|
|
|
(0.06563)
|
(0.00549)
|
(0.04588)
|
|
0.000000
|
0.000000
|
1.000000
|
0.000000
|
-0.363828
|
-0.042591
|
-0.232651
|
|
|
|
|
(0.03766)
|
(0.00315)
|
(0.02633)
|
|
0.000000
|
0.000000
|
0.000000
|
1.000000
|
-2.095564
|
0.154165
|
-0.456795
|
|
|
|
|
(0.22497)
|
(0.01883)
|
(0.15728)
|
Adjustment coefficients (standard error in parentheses)
D(AEX) -0.013495 0.008187 -0.005555 -7.88E-05
(0.00872) (0.00168) (0.00194) (0.00035)
|
|
|
|
|
|
|
|
D(BEL20)
|
0.102141
|
-0.000810
|
-0.005178
|
-0.004486
|
|
|
|
(0.06687)
|
(0.01292)
|
(0.01485)
|
(0.00270)
|
|
|
|
D(CAC40)
|
-0.096068
|
0.099830
|
-0.077557
|
-0.001861
|
|
|
|
(0.10082)
|
(0.01948)
|
(0.02239)
|
(0.00408)
|
|
|
|
D(DAX)
|
0.469251
|
0.027844
|
0.559952
|
-0.127284
|
|
|
|
(0.37064)
|
(0.07162)
|
(0.08232)
|
(0.01499)
|
|
|
|
D(FTSE100)
|
4.174692
|
-0.097728
|
0.222439
|
0.058817
|
|
|
|
(0.61549)
|
(0.11893)
|
(0.13670)
|
(0.02489)
|
|
|
|
D(MIB30)
|
1.106277
|
0.395191
|
2.501919
|
-0.589132
|
|
|
|
(1.72993)
|
(0.33427)
|
(0.38422)
|
(0.06997)
|
|
|
|
D(SSMI)
|
-3.225329
|
0.077850
|
0.620373
|
0.011535
|
|
|
|
(0.44271)
|
(0.08554)
|
(0.09833)
|
(0.01791)
|
|
|
|
5 Cointegrating Equation(s):
|
Log likelihood
|
-51714.36
|
|
|
|
|
Normalized cointegrating coefficients (standard error in
parentheses)
|
|
|
|
|
AEX
|
BEL20
|
CAC40
|
DAX
|
FTSE100
|
MIB30
|
SSMI
|
|
1.000000
|
0.000000
|
0.000000
|
0.000000
|
0.000000
|
-0.001402
|
-0.071257
|
|
|
|
|
|
(0.00235)
|
(0.01491)
|
|
0.000000
|
1.000000
|
0.000000
|
0.000000
|
0.000000
|
-0.046543
|
-0.420295
|
|
|
|
|
|
(0.01051)
|
(0.06669)
|
|
0.000000
|
0.000000
|
1.000000
|
0.000000
|
0.000000
|
-0.032111
|
-0.528627
|
|
|
|
|
|
(0.00758)
|
(0.04810)
|
|
0.000000
|
0.000000
|
0.000000
|
1.000000
|
0.000000
|
0.214531
|
-2.161544
|
|
|
|
|
|
(0.04413)
|
(0.28006)
|
|
0.000000
|
0.000000
|
0.000000
|
0.000000
|
1.000000
|
0.028807
|
-0.813503
|
|
|
|
|
|
(0.01839)
|
(0.11668)
|
|
Adjustment coefficients (standard error in parentheses)
|
|
|
|
|
|
D(AEX)
|
-0.015990
|
0.008255
|
-0.005370
|
-6.13E-05
|
-3.87E-05
|
|
|
(0.01399)
|
(0.00171)
|
(0.00210)
|
(0.00036)
|
(0.00068)
|
|
|
D(BEL20)
|
0.165389
|
-0.002533
|
-0.009873
|
-0.004928
|
-0.001798
|
|
|
(0.10724)
|
(0.01312)
|
(0.01610)
|
(0.00277)
|
(0.00525)
|
|
|
D(CAC40)
|
-0.003198
|
0.097300
|
-0.084450
|
-0.002510
|
-0.004021
|
|
|
|
|
|
|
|
|
|
(0.16168)
|
(0.01978)
|
(0.02427)
|
(0.00417)
|
(0.00791)
|
|
|
D(DAX)
|
0.455104
|
0.028230
|
0.561002
|
-0.127185
|
-0.012661
|
|
|
(0.59448)
|
(0.07273)
|
(0.08926)
|
(0.01534)
|
(0.02910)
|
|
|
D(FTSE100)
|
4.187641
|
-0.098080
|
0.221477
|
0.058726
|
-0.708188
|
|
|
(0.98722)
|
(0.12077)
|
(0.14822)
|
(0.02547)
|
(0.04832)
|
|
|
D(MIB30)
|
0.374996
|
0.415113
|
2.556201
|
-0.584017
|
-0.015672
|
|
|
(2.77461)
|
(0.33943)
|
(0.41659)
|
(0.07159)
|
(0.13581)
|
|
|
D(SSMI)
|
-2.628328
|
0.061585
|
0.576058
|
0.007359
|
0.138582
|
|
|
(0.70976)
|
(0.08683)
|
(0.10656)
|
(0.01831)
|
(0.03474)
|
|
|
6 Cointegrating Equation(s):
|
Log likelihood
|
-51711.04
|
|
|
|
|
Normalized cointegrating coefficients (standard error in
parentheses)
|
|
|
|
|
AEX
|
BEL20
|
CAC40
|
DAX
|
FTSE100
|
MIB30
|
SSMI
|
|
1.000000
|
0.000000
|
0.000000
|
0.000000
|
0.000000
|
0.000000
|
-0.081534
|
|
|
|
|
|
|
(0.00688)
|
|
0.000000
|
1.000000
|
0.000000
|
0.000000
|
0.000000
|
0.000000
|
-0.761600
|
|
|
|
|
|
|
(0.06325)
|
|
0.000000
|
0.000000
|
1.000000
|
0.000000
|
0.000000
|
0.000000
|
-0.764096
|
|
|
|
|
|
|
(0.04443)
|
|
0.000000
|
0.000000
|
0.000000
|
1.000000
|
0.000000
|
0.000000
|
-0.588376
|
|
|
|
|
|
|
(0.16111)
|
|
0.000000
|
0.000000
|
0.000000
|
0.000000
|
1.000000
|
0.000000
|
-0.602261
|
|
|
|
|
|
|
(0.03729)
|
|
0.000000
|
0.000000
|
0.000000
|
0.000000
|
0.000000
|
1.000000
|
-7.333040
|
|
|
|
|
|
|
(0.94100)
|
|
Adjustment coefficients (standard error in parentheses)
|
|
|
|
|
|
D(AEX)
|
-0.022512
|
0.007877
|
-0.004626
|
-0.000273
|
-5.02E-05
|
-0.000149
|
|
(0.01458)
|
(0.00173)
|
(0.00215)
|
(0.00039)
|
(0.00068)
|
(0.00012)
|
|
D(BEL20)
|
0.090000
|
-0.006895
|
-0.001276
|
-0.007381
|
-0.001931
|
-0.000274
|
|
(0.11162)
|
(0.01322)
|
(0.01647)
|
(0.00295)
|
(0.00524)
|
(0.00092)
|
|
D(CAC40)
|
-0.063799
|
0.093793
|
-0.077540
|
-0.004482
|
-0.004128
|
-0.001959
|
|
(0.16857)
|
(0.01996)
|
(0.02487)
|
(0.00445)
|
(0.00791)
|
(0.00139)
|
|
D(DAX)
|
0.473060
|
0.029269
|
0.558954
|
-0.126601
|
-0.012629
|
-0.047766
|
|
(0.62023)
|
(0.07344)
|
(0.09151)
|
(0.01638)
|
(0.02910)
|
(0.00512)
|
|
D(FTSE100)
|
4.097953
|
-0.103270
|
0.231705
|
0.055809
|
-0.708347
|
-0.015467
|
|
(1.02993)
|
(0.12196)
|
(0.15195)
|
(0.02721)
|
(0.04832)
|
(0.00849)
|
|
D(MIB30)
|
0.572667
|
0.426550
|
2.533661
|
-0.577587
|
-0.015323
|
-0.229325
|
|
(2.89469)
|
(0.34277)
|
(0.42708)
|
(0.07646)
|
(0.13581)
|
(0.02387)
|
|
D(SSMI)
|
-2.753214
|
0.054360
|
0.590299
|
0.003296
|
0.138361
|
-0.011063
|
|
(0.74039)
|
(0.08767)
|
(0.10923)
|
(0.01956)
|
(0.03474)
|
(0.00611)
|
VECM
Vector Error Correction Estimates
Date: 05/30/11 Time: 12:21
Sample (adjusted): 5 1250
Included observations: 1250 after adjustments Standard errors in
( ) & t-statistics in [ ]
Cointegrating Eq: CointEq1
AEX(-1) 1.000000
BEL20(-1) -0.022232
(0.01952)
[-1.13919]
CAC40(-1) -0.011678
(0.02468)
[-0.47323]
DAX(-1) 0.006143
(0.00461)
[ 1.33296]
FTSE100(-1) -0.129930
(0.00817)
[-15.9069]
MIB30(-1) -0.002417
(0.00151)
[-1.60295]
SSMI(-1) 0.036681
(0.00685)
[ 5.35757]
C 208.2633
Error Correction: D(AEX) D(BEL20) D(CAC40) D(DAX) D(FTSE100)
D(MIB30) D(SSMI)
CointEq1 0.000806 0.025211 0.043489 0.100088 5.273059 0.103361
-1.373316
(0.00525) (0.03993) (0.06088) (0.23014) (0.36829) (1.07477)
(0.27042)
[ 0.15345] [ 0.63138] [ 0.71433] [ 0.43489] [ 14.3178] [ 0.09617]
[-5.07843]
D(AEX(-1)) 0.196660 2.852896 1.830724 0.964952 -0.339623
-9.602110 3.048412
(0.08552) (0.65001) (0.99107) (3.74646) (5.99525) (17.4959)
(4.40212)
[ 2.29955] [ 4.38898] [ 1.84722] [ 0.25756] [-0.05665] [-0.54882]
[ 0.69249]
D(AEX(-2)) -0.145930 -0.079490 -2.079784 1.774018 5.336141
1.045396 3.471691
(0.08568) (0.65126) (0.99296) (3.75361) (6.00670) (17.5293)
(4.41052)
[-1.70311] [-0.12206] [-2.09452] [ 0.47262] [ 0.88836] [ 0.05964]
[ 0.78714]
D(AEX(-3)) 0.026540 -1.062147 0.088737 2.944510 -3.677627
31.48520 0.702597
(0.08521) (0.64763) (0.98744) (3.73273) (5.97328) (17.4318)
(4.38599)
[ 0.31148] [-1.64005] [ 0.08987] [ 0.78884] [-0.61568] [ 1.80620]
[ 0.16019]
D(BEL20(-1)) 0.022909 -0.143406 0.254962 0.371046 0.725088
1.541486 0.687198
(0.00446) (0.03387) (0.05164) (0.19522) (0.31241) (0.91170)
(0.22939)
[ 5.14058] [-4.23379] [ 4.93692] [ 1.90061] [ 2.32097] [ 1.69079]
[ 2.99575]
D(BEL20(-2)) 0.006403 -0.031288 0.064764 0.529527 0.546551
1.726186 0.292853
(0.00463) (0.03517) (0.05363) (0.20273) (0.32441) (0.94673)
(0.23821)
[ 1.38355] [-0.88955] [ 1.20764] [ 2.61203] [ 1.68474] [ 1.82331]
[ 1.22941]
D(BEL20(-3)) 0.005314 0.008555 0.009840 0.476399 0.078105
2.846244 -0.045368
(0.00434) (0.03296) (0.05025) (0.18997) (0.30399) (0.88713)
(0.22321)
[ 1.22544] [ 0.25957] [ 0.19581] [ 2.50783] [ 0.25693] [ 3.20836]
[-0.20325]
D(CAC40(-1)) -0.029807 -0.040019 -0.332149 0.616962 -0.244969
0.717107 0.073005
(0.00732) (0.05562) (0.08481) (0.32058) (0.51301) (1.49712)
(0.37669)
[-4.07306] [-0.71949] [-3.91658] [ 1.92449] [-0.47751] [ 0.47899]
[ 0.19381]
D(CAC40(-2)) 0.008033 0.039834 0.083231 0.163735 -0.731970
1.687685 -0.103343
(0.00732) (0.05563) (0.08482) (0.32064) (0.51310) (1.49738)
(0.37675)
[ 1.09744] [ 0.71604] [ 0.98127] [ 0.51065] [-1.42656] [ 1.12709]
[-0.27430]
D(CAC40(-3)) -0.008977 0.066696 -0.070384 0.083483 0.218564
-1.375739 0.019420
(0.00727) (0.05528) (0.08429) (0.31863) (0.50989) (1.48801)
(0.37440)
[-1.23426] [ 1.20644] [-0.83502] [ 0.26200] [ 0.42865] [-0.92455]
[ 0.05187]
D(DAX(-1)) -0.000347 -0.006931 -0.005571 -0.732005 0.326012
-0.498287 0.076858
(0.00101) (0.00771) (0.01175) (0.04443) (0.07110) (0.20749)
(0.05221)
[-0.34236] [-0.89915] [-0.47399] [-16.4750] [ 4.58521] [-2.40147]
[ 1.47217]
D(DAX(-2)) -0.002407 -0.019322 -0.027662 -0.586939 0.172197
-0.777929 0.074634
(0.00112) (0.00850) (0.01296) (0.04897) (0.07837) (0.22870)
(0.05754)
[-2.15310] [-2.27406] [-2.13520] [-11.9850] [ 2.19727] [-3.40149]
[ 1.29700]
D(DAX(-3)) -0.000395 -0.000338 0.000121 -0.455492 0.083365
-0.936259 0.108990
(0.00098) (0.00746) (0.01138) (0.04302) (0.06885) (0.20092)
(0.05055)
[-0.40169] [-0.04533] [ 0.01062] [-10.5869] [ 1.21082] [-4.65979]
[ 2.15591]
D(FTSE100(-1)) 0.000283 0.004959 0.006435 -0.002136 -0.200321
-0.039135 -0.159889
(0.00064) (0.00484) (0.00738) (0.02789) (0.04464) (0.13027)
(0.03278)
[ 0.44492] [ 1.02472] [ 0.87212] [-0.07658] [-4.48771] [-0.30042]
[-4.87825]
D(FTSE100(-2)) -5.94E-05 0.003303 0.000200 -0.027275 -0.097493
-0.073939 -0.150426
(0.00056) (0.00423) (0.00644) (0.02435) (0.03897) (0.11374)
(0.02862)
[-0.10689] [ 0.78162] [ 0.03097] [-1.11989] [-2.50152] [-0.65009]
[-5.25650]
D(FTSE100(-3)) 2.37E-05 0.002730 0.001616 0.060033 0.009479
0.285405 0.055499
(0.00042) (0.00320) (0.00488) (0.01845) (0.02952) (0.08615)
(0.02168)
[ 0.05630] [ 0.85284] [ 0.33117] [ 3.25428] [ 0.32111] [ 3.31293]
[ 2.56042]
D(MIB30(-1)) -5.03E-05 0.000907 0.000141 -0.017571 0.013809
-0.647967 -0.006502
(0.00023) (0.00173) (0.00264) (0.00996) (0.01594) (0.04652)
(0.01170)
[-0.22108] [ 0.52467] [ 0.05333] [-1.76397] [ 0.86633] [-13.9295]
[-0.55550]
D(MIB30(-2)) 0.000540 0.004680 0.006431 -0.017226 0.021062
-0.421731 -0.000196
(0.00025) (0.00189) (0.00288) (0.01087) (0.01740) (0.05077)
(0.01277)
[ 2.17462] [ 2.48115] [ 2.23612] [-1.58451] [ 1.21066] [-8.30672]
[-0.01535]
D(MIB30(-3)) 0.000152 0.000460 0.000814 -0.019429 0.013038
-0.263843 -0.004297
(0.00022) (0.00168) (0.00257) (0.00970) (0.01553) (0.04532)
(0.01140)
[ 0.68503] [ 0.27349] [ 0.31702] [-2.00200] [ 0.83955] [-5.82169]
[-0.37679]
D(SSMI(-1)) -7.40E-05 -0.002428 -0.001010 0.029268 -0.136217
0.238025 -0.647691
(0.00054) (0.00412) (0.00628) (0.02374) (0.03799) (0.11086)
(0.02789)
[-0.13647] [-0.58940] [-0.16086] [ 1.23289] [-3.58578] [ 2.14707]
[-23.2201]
D(SSMI(-2)) -0.000582 -0.005066 -0.007380 0.016615 -0.097617
0.230174 -0.418012
(0.00061) (0.00460) (0.00702) (0.02653) (0.04246) (0.12392)
(0.03118)
[-0.96047] [-1.10044] [-1.05137] [ 0.62617] [-2.29895] [ 1.85751]
[-13.4072]
D(SSMI(-3)) -0.000441 -0.003412 -0.004692 0.010680 -0.047369
0.155393 -0.205658
(0.00053) (0.00401) (0.00611) (0.02310) (0.03696) (0.10787)
(0.02714)
[-0.83699] [-0.85149] [-0.76784] [ 0.46238] [-1.28152] [ 1.44055]
[-7.57734]
|
C -0.001863 -0.289613
(0.15218) (1.15664)
[-0.01224] [-0.25039]
|
0.114079 (1.76352) [ 0.06469]
|
3.826050 (6.66646) [ 0.57393]
|
0.997372 (10.6680) [ 0.09349]
|
-11.95328 (31.1323) [-0.38395]
|
1.879133 (7.83315) [ 0.23990]
|
|
R-squared 0.048695 0.082476
|
0.048989
|
0.556566
|
0.489530
|
0.486890
|
0.388942
|
|
Adj. R-squared 0.031582 0.065971
|
0.031882
|
0.548589
|
0.480347
|
0.477660
|
0.377950
|
|
Sum sq. resids 35196.42 2033283.
|
4726747.
|
67545040
|
1.73E+08
|
1.47E+09
|
93255717
|
|
S.E. equation 5.364583 40.77422
|
62.16815
|
235.0085
|
376.0712
|
1097.485
|
276.1369
|
|
F-statistic 2.845558 4.997031
|
2.863642
|
69.77360
|
53.31048
|
52.75028
|
35.38397
|
|
Log likelihood -3849.444 -6376.620
|
-6902.174
|
-8559.078
|
-9144.894
|
-10479.36
|
-8760.027
|
|
Akaike AIC 6.215801 10.27226
|
11.11585
|
13.77541
|
14.71572
|
16.85772
|
14.09796
|
|
Schwarz SC 6.310454 10.36692
|
11.21050
|
13.87006
|
14.81037
|
16.95237
|
14.19261
|
|
Mean dependent -0.023114 -0.361790
|
-0.073836
|
1.313002
|
0.552167
|
-7.232592
|
0.715730
|
|
S.D. dependent 5.451357 42.18960
|
63.18351
|
349.7820
|
521.6912
|
1518.526
|
350.1160
|
|
Determinant resid covariance (dof adj.) 3.69E+27
|
|
|
|
|
|
|
Determinant resid covariance 3.24E+27
|
|
|
|
|
|
|
Log likelihood -51840.25
|
|
|
|
|
|
|
Akaike information criterion 83.48034
|
|
|
|
|
|
|
Schwarz criterion 84.17171
|
|
|
|
|
|
|
Causalité
|
|
|
|
|
|
|
Pairwise Granger Causality Tests
|
|
|
|
|
|
|
Date: 05/30/11 Time: 12:23
|
|
|
|
|
|
|
Sample: 1 1250
|
|
|
|
|
|
|
Lags: 2
|
|
|
|
|
|
|
Null Hypothesis:
|
Obs
|
F-Statistic
|
Prob.
|
|
|
|
BE20 does not Granger Cause AEX
|
1247
|
15.4092
|
2.E-07
|
|
|
|
AEX does not Granger Cause BE20
|
|
12.0595
|
6.E-06
|
|
|
|
CAC40 does not Granger Cause AEX
|
1247
|
7.00492
|
0.0009
|
|
|
|
AEX does not Granger Cause CAC40
|
|
5.95261
|
0.0027
|
|
|
|
DAX does not Granger Cause AEX
AEX does not Granger Cause
DAX
|
1239
|
0.46252
252.221
|
0.6298
1.E-92
|
|
FTSE100 does not Granger Cause AEX
|
1219
|
0.53042
|
0.5885
|
|
AEX does not Granger Cause FTSE100
|
|
6.58360
|
0.0014
|
|
MIB30 does not Granger Cause AEX
|
1235
|
14.8616
|
4.E-07
|
|
AEX does not Granger Cause MIB30
|
|
188.739
|
3.E-72
|
|
SSMI does not Granger Cause AEX
|
1239
|
3.57518
|
0.0283
|
|
AEX does not Granger Cause SSMI
|
|
3.69904
|
0.0250
|
|
CAC40 does not Granger Cause BE20
|
1247
|
8.15722
|
0.0003
|
|
BE20 does not Granger Cause CAC40
|
|
16.2514
|
1.E-07
|
|
DAX does not Granger Cause BE20
|
1239
|
1.05474
|
0.3486
|
|
BE20 does not Granger Cause DAX
|
|
127.902
|
3.E-51
|
|
FTSE100 does not Granger Cause BE20
|
1219
|
1.40439
|
0.2459
|
|
BE20 does not Granger Cause FTSE100
|
|
48.2435
|
7.E-21
|
|
MIB30 does not Granger Cause BE20
|
1235
|
15.1355
|
3.E-07
|
|
BE20 does not Granger Cause MIB30
|
|
97.8911
|
4.E-40
|
|
SSMI does not Granger Cause BE20
|
1239
|
3.41556
|
0.0332
|
|
BE20 does not Granger Cause SSMI
|
|
23.7874
|
7.E-11
|
|
DAX does not Granger Cause CAC40
|
1239
|
1.06033
|
0.3467
|
|
CAC40 does not Granger Cause DAX
|
|
255.165
|
2.E-93
|
|
FTSE100 does not Granger Cause CAC40
|
1219
|
2.04248
|
0.1302
|
|
CAC40 does not Granger Cause FTSE100
|
|
6.88765
|
0.0011
|
|
MIB30 does not Granger Cause CAC40
|
1235
|
12.4472
|
4.E-06
|
|
CAC40 does not Granger Cause MIB30
|
|
177.961
|
1.E-68
|
|
SSMI does not Granger Cause CAC40
|
1239
|
7.29282
|
0.0007
|
|
CAC40 does not Granger Cause SSMI
|
|
4.48664
|
0.0114
|
|
|
|
|
|
146
|
|
|
|
FTSE100 does not Granger Cause DAX
DAX does not Granger
Cause FTSE100
|
1215
|
186.999
5.80865
|
2.E-71
0.0031
|
|
MIB30 does not Granger Cause DAX
|
1235
|
1.33238
|
0.2642
|
|
DAX does not Granger Cause MIB30
|
|
173.669
|
4.E-67
|
|
SSMI does not Granger Cause DAX
|
1231
|
102.042
|
1.E-41
|
|
DAX does not Granger Cause SSMI
|
|
6.00895
|
0.0025
|
|
MIB30 does not Granger Cause FTSE100
|
1211
|
10.7499
|
2.E-05
|
|
FTSE100 does not Granger Cause MIB30
|
|
249.484
|
2.E-91
|
|
SSMI does not Granger Cause FTSE100
|
1212
|
4.86855
|
0.0078
|
|
FTSE100 does not Granger Cause SSMI
|
|
1.15702
|
0.3148
|
|
SSMI does not Granger Cause MIB30
|
1227
|
134.987
|
1.E-53
|
|
MIB30 does not Granger Cause SSMI
|
|
14.6184
|
5.E-07
|
|
I P pLiThF dh noLd
|
|
VAR 1
|
VAR 2
|
VAR 3
|
VAR 4
|
|
AIC
|
30.42
|
30.149
|
30.042
|
29.97
|
|
SC
|
30.44
|
30.19
|
30.10
|
30.05
|
Co-integration
Date: 05/30/11 Time: 12:28
Sample (adjusted): 5 1250
Included observations: 1250 after adjustments Trend assumption:
No deterministic trend Series: SP500 SPTS
Lags interval (in first differences): 1 to 3
Unrestricted Cointegration Rank Test (Trace)
Hypothesized Trace 0.05
No. of CE(s) Eigenvalue Statistic Critical Value Prob.**
None * 0.072997 94.82575 12.32090 0.0001
At most 1 0.000305 0.380540 4.129906 0.6005
Trace test indicates 1 cointegrating eqn(s) at the 0.05 level *
denotes rejection of the hypothesis at the 0.05 level **MacKinnon-Haug-Michelis
(1999) p-values
Unrestricted Cointegration Rank Test (Maximum Eigenvalue)
Hypothesized Max-Eigen 0.05
No. of CE(s) Eigenvalue Statistic Critical Value Prob.**
None * 0.072997 94.44521 11.22480 0.0001
At most 1 0.000305 0.380540 4.129906 0.6005
Max-eigenvalue test indicates 1 cointegrating eqn(s) at the 0.05
level * denotes rejection of the hypothesis at the 0.05 level
**MacKinnon-Haug-Michelis (1999) p-values
Unrestricted Cointegrating Coefficients (normalized by
b'*S11*b=I):
SP500 SPTS
-0.006210 0.000661
0.000612 2.09E-05
Unrestricted Adjustment Coefficients (alpha):
D(SP500) 10.17572 -1.853936
D(SPTS) -404.7969 -16.70047
1 Cointegrating Equation(s): Log likelihood -18665.66
Normalized cointegrating coefficients (standard error in
parentheses)
SP500 SPTS
1.000000 -0.106474
(0.00140)
Adjustment coefficients (standard error in parentheses)
D(SP500) -0.063193
(0.01978)
D(SPTS) 2.513849
(0.30529)
VECM
Vector Error Correction Estimates
Date: 05/30/11 Time: 12:28
Sample (adjusted): 5 1250
Included observations: 1250 after adjustments Standard errors in
( ) & t-statistics in [ ]
|
Cointegrating Eq:
|
CointEq1
|
|
|
SP500(-1)
|
1.000000
|
|
|
SPTS(-1)
|
-0.106474
|
|
|
(0.00140)
|
|
|
[-76.2824]
|
|
|
Error Correction:
|
D(SP500)
|
D(SPTS)
|
|
CointEq1
|
-0.063193
|
2.513849
|
|
(0.01978)
|
(0.30529)
|
|
[-3.19464]
|
[ 8.23434]
|
D(SP500(-1)) -0.694513 -2.559175
(0.03181) (0.49097)
[-21.8317] [-5.21247]
D(SP500(-2)) -0.459081 -2.230026
(0.03401) (0.52492)
[-13.4976] [-4.24828]
D(SP500(-3)) -0.216340 -0.246524
(0.02878) (0.44418)
[-7.51700] [-0.55501]
D(SPTS(-1)) -0.003336 -0.430587
(0.00235) (0.03622)
[-1.42173] [-11.8894]
D(SPTS(-2)) -0.001232 -0.233782
(0.00227) (0.03506)
[-0.54247] [-6.66885]
D(SPTS(-3)) -0.003383 -0.169750
(0.00188) (0.02896)
[-1.80309] [-5.86169]
R-squared 0.372979 0.345559
Adj. R-squared 0.369943 0.342390
Sum sq. resids 15663066 3.73E+09
S.E. equation 112.4353 1735.271
F-statistic 122.8352 109.0366
Log likelihood -7648.571 -11058.30
Akaike AIC 12.28824 17.76132
Schwarz SC 12.31704 17.79012
Mean dependent -0.030562 1.846926
S.D. dependent 141.6488 2139.849
Determinant resid covariance (dof adj.) 3.56E+10
Determinant resid covariance 3.52E+10
Log likelihood -18665.66
|
Akaike information criterion
|
29.98661
|
|
|
|
Schwarz criterion
|
30.05246
|
|
|
|
CausalitéPairwise Granger
Causality Tests
|
|
|
|
|
Date: 05/30/11 Time: 12:29
|
|
|
|
|
Sample: 1 1250
|
|
|
|
|
Lags: 2
|
|
|
|
|
Null Hypothesis:
|
Obs
|
F-Statistic
|
Prob.
|
|
SPTSX does not Granger Cause SP500
|
1126
|
2.68042
|
0.0690
|
|
SP500 does not Granger Cause SPTSX
|
|
43.2690
|
8.E-19
|
|
I \iF1SIIifiThF
|
|
VAR 1
|
VAR 2
|
VAR 3
|
VAR 4
|
|
AIC
|
133.77
|
133.07
|
132.789
|
132.54
|
|
SC
|
137.14
|
133.77
|
133.826
|
133.91
|
Co-integration
Date: 05/30/11 Time: 12:32
Sample (adjusted): 5 1250
Included observations: 1250 after adjustments
Trend assumption: Linear deterministic trend
Series: ALLORDINARIES BSE30 HANGSENG JKSE KLSE KS11 NIKKEI225
SHANGCOMP STI Lags interval (in first differences): 1 to 3
Unrestricted Cointegration Rank Test (Trace)
|
Intégration financière internationale
face à une stratégie de diversification de
portefeuille
|
|
Hypothesized
No. of CE(s) Eigenvalue
|
Trace
Statistic
|
0.05
Critical Value
|
Prob.**
|
|
None * 0.193499
|
973.0867
|
197.3709
|
0.0001
|
|
At most 1 * 0.154207
|
705.1337
|
159.5297
|
0.0000
|
|
At most 2 * 0.126327
|
496.4526
|
125.6154
|
0.0001
|
|
At most 3 * 0.087022
|
328.1820
|
95.75366
|
0.0000
|
|
At most 4 * 0.073948
|
214.7418
|
69.81889
|
0.0000
|
|
At most 5 * 0.059403
|
119.0180
|
47.85613
|
0.0000
|
|
At most 6 * 0.026600
|
42.71173
|
29.79707
|
0.0010
|
|
At most 7 0.004880
|
9.119399
|
15.49471
|
0.3545
|
|
At most 8 0.002424
|
3.024395
|
3.841466
|
0.0820
|
|
Trace test indicates 7 cointegrating eqn(s) at the 0.05 level
|
|
|
|
|
* denotes rejection of the hypothesis at the 0.05 level
|
|
|
|
|
**MacKinnon-Haug-Michelis (1999) p-values
|
|
|
|
|
Unrestricted Cointegration Rank Test (Maximum Eigenvalue)
|
|
|
|
Hypothesized
|
Max-Eigen
|
0.05
|
|
|
No. of CE(s) Eigenvalue
|
Statistic
|
Critical Value
|
Prob.**
|
|
None * 0.193499
|
267.9530
|
58.43354
|
0.0000
|
|
At most 1 * 0.154207
|
208.6811
|
52.36261
|
0.0001
|
|
At most 2 * 0.126327
|
168.2706
|
46.23142
|
0.0000
|
|
At most 3 * 0.087022
|
113.4402
|
40.07757
|
0.0000
|
|
At most 4 * 0.073948
|
95.72386
|
33.87687
|
0.0000
|
|
At most 5 * 0.059403
|
76.30625
|
27.58434
|
0.0000
|
|
At most 6 * 0.026600
|
33.59233
|
21.13162
|
0.0006
|
|
At most 7 0.004880
|
6.095004
|
14.26460
|
0.6010
|
|
At most 8 0.002424
|
3.024395
|
3.841466
|
0.0820
|
Max-eigenvalue test indicates 7 cointegrating eqn(s) at the 0.05
level * denotes rejection of the hypothesis at the 0.05 level
**MacKinnon-Haug-Michelis (1999) p-values
Unrestricted Cointegrating Coefficients (normalized by
b'*S11*b=I):
|
ALLORDINARIES
|
BSE30
|
HANGSENG
|
JKSE
|
KLSE
|
KS11
|
NIKKEI225
|
SHA
|
|
0.001370
|
0.000269
|
-0.000315
|
0.001165
|
-0.014373
|
-0.001189
|
-0.000317
|
0.
|
|
0.000628
|
0.000527
|
-6.08E-05
|
-0.005301
|
0.007759
|
0.001715
|
-0.000295
|
-0.
|
|
-0.003074
|
0.000102
|
0.000480
|
-0.001628
|
-0.003130
|
-0.006400
|
0.000239
|
0.
|
|
0.000464
|
0.000407
|
-0.000217
|
0.001042
|
0.003013
|
-0.006451
|
0.000125
|
-4.
|
|
-0.002372
|
0.000157
|
-0.000443
|
-0.000529
|
-0.001264
|
0.003696
|
0.000121
|
-1.
|
|
-0.000811
|
0.000334
|
0.000146
|
-0.000494
|
-0.003241
|
0.001168
|
0.000416
|
0.
|
|
5.04E-05
|
5.74E-05
|
0.000260
|
0.000888
|
-0.002463
|
0.000185
|
-9.18E-05
|
-0.
|
|
-0.000694
|
0.000110
|
3.38E-05
|
0.000552
|
-0.000644
|
2.44E-05
|
-0.000128
|
0.
|
|
0.000490
|
-1.27E-05
|
4.19E-06
|
8.06E-05
|
3.93E-06
|
0.000276
|
1.31E-05
|
0.
|
|
Unrestricted Adjustment Coefficients (alpha):
|
|
|
|
|
|
|
|
D(ALLORDINARIES)
|
-12.61048
|
-24.32550
|
35.74549
|
-14.70375
|
25.40403
|
-6.116341
|
-10
|
|
D(BSE30)
|
-95.90700
|
-403.3727
|
156.0923
|
-226.5825
|
-69.97491
|
-216.4804
|
-33
|
|
D(HANGSENG)
|
300.1810
|
-0.551286
|
-285.2605
|
159.3466
|
176.1558
|
-101.4958
|
-82
|
|
D(JKSE)
|
23.56179
|
72.86116
|
35.39353
|
-28.24612
|
1.370294
|
-0.347172
|
-8.
|
|
D(KLSE)
|
45.28884
|
-0.196880
|
5.946693
|
-11.04083
|
-3.005862
|
7.444522
|
3.
|
|
D(KS11)
|
15.13820
|
1.702805
|
23.63166
|
29.15006
|
-11.81490
|
-13.61403
|
-0.
|
|
D(NIKKEI225)
|
200.7021
|
267.5029
|
-56.92639
|
-96.95929
|
-112.5904
|
-287.6652
|
48
|
|
D(SHANGCOMP)
|
-17.68201
|
23.30591
|
-21.71445
|
15.82100
|
13.71273
|
-0.111036
|
26
|
|
D(STI)
|
5.520858
|
1.803964
|
-21.58795
|
-6.281806
|
-28.99748
|
9.434907
|
-7.
|
|
1 Cointegrating Equation(s):
|
|
Log likelihood
|
-82592.82
|
|
|
|
|
|
Normalized cointegrating coefficients (standard error in
parentheses)
|
|
|
|
|
|
|
ALLORDINARIES
|
BSE30
|
HANGSENG
|
JKSE
|
KLSE
|
KS11
|
NIKKEI225
|
SHA
|
1.000000 0.196338 -0.230075 0.850115 -10.48760 -0.867554
-0.231648 0.
(0.03513) (0.03310) (0.24692) (0.74455) (0.42662) (0.02326)
(0.
Adjustment coefficients (standard error in parentheses)
D(ALLORDINARIES) -0.017282
(0.00981)
D(BSE30) -0.131434
(0.07147)
D(HANGSENG) 0.411378
(0.06502)
D(JKSE) 0.032290
(0.01028)
D(KLSE) 0.062065
(0.00467)
D(KS11) 0.020746
(0.00591)
D(NIKKEI225) 0.275049
(0.06727)
D(SHANGCOMP) -0.024232
(0.00962)
D(STI) 0.007566
(0.00665)
2 Cointegrating Equation(s): Log likelihood -82488.48
Normalized cointegrating coefficients (standard error in
parentheses)
ALLORDINARIES BSE30 HANGSENG JKSE KLSE KS11 NIKKEI225 SHA
|
1.000000
|
0.000000
|
-0.270743
|
3.688753
|
-17.46586
|
-1.966764
|
-0.158742
|
0.
|
|
|
(0.04832)
|
(0.32622)
|
(1.12617)
|
(0.63215)
|
(0.03504)
|
(0.
|
|
0.000000
|
1.000000
|
0.207133
|
-14.45788
|
35.54198
|
5.598548
|
-0.371328
|
-2.
|
|
|
(0.13398)
|
(0.90444)
|
(3.12230)
|
(1.75264)
|
(0.09716)
|
(0.
|
|
Adjustment coefficients (standard error in parentheses)
|
|
|
|
|
|
|
|
D(ALLORDINARIES)
|
-0.032553
|
-0.016208
|
|
|
|
|
|
|
(0.01074)
|
(0.00421)
|
|
|
|
|
|
|
D(BSE30)
|
-0.384659
|
-0.238301
|
|
|
|
|
|
|
(0.07666)
|
(0.03008)
|
|
|
|
|
|
|
D(HANGSENG)
|
0.411032
|
0.080479
|
|
|
|
|
|
|
(0.07151)
|
(0.02806)
|
|
|
|
|
|
|
Intégration financière internationale
face à une stratégie de diversification de
portefeuille
|
|
D(JKSE)
|
0.078030
|
0.044723
|
|
(0.01086)
|
(0.00426)
|
|
D(KLSE)
|
0.061942
|
0.012082
|
|
(0.00514)
|
(0.00202)
|
|
D(KS11)
|
0.021815
|
0.004970
|
|
(0.00650)
|
(0.00255)
|
|
D(NIKKEI225)
|
0.442979
|
0.194923
|
|
(0.07308)
|
(0.02868)
|
|
D(SHANGCOMP)
|
-0.009601
|
0.007520
|
|
(0.01053)
|
(0.00413)
|
|
D(STI)
|
0.008698
|
0.002436
|
|
(0.00731)
|
(0.00287)
|
3 Cointegrating Equation(s): Log likelihood -82404.35
Normalized cointegrating coefficients (standard error in
parentheses)
ALLORDINARIES BSE30 HANGSENG JKSE KLSE KS11 NIKKEI225 SHA
|
1.000000
|
0.000000
|
0.000000
|
-4.417774
|
26.33932
|
7.467030
|
-0.005741
|
-1.
|
|
|
|
(0.51649)
|
(1.82718)
|
(0.95049)
|
(0.05642)
|
(0.
|
|
0.000000
|
1.000000
|
0.000000
|
-8.255953
|
2.028647
|
-1.618815
|
-0.488382
|
-0.
|
|
|
|
(0.55976)
|
(1.98025)
|
(1.03011)
|
(0.06114)
|
(0.
|
|
0.000000
|
0.000000
|
1.000000
|
-29.94173
|
161.7959
|
34.84404
|
0.565117
|
-8.
|
|
|
|
(2.96748)
|
(10.4980)
|
(5.46101)
|
(0.32414)
|
(1.
|
|
Adjustment coefficients (standard error in parentheses)
|
|
|
|
|
|
|
|
D(ALLORDINARIES)
|
-0.142417
|
-0.012562
|
0.022604
|
|
|
|
|
|
(0.02413)
|
(0.00423)
|
(0.00407)
|
|
|
|
|
|
D(BSE30)
|
-0.864409
|
-0.222382
|
0.129665
|
|
|
|
|
|
(0.17342)
|
(0.03041)
|
(0.02924)
|
|
|
|
|
|
D(HANGSENG)
|
1.287781
|
0.051386
|
-0.231460
|
|
|
|
|
|
(0.15997)
|
(0.02805)
|
(0.02698)
|
|
|
|
|
|
D(JKSE)
|
-0.030752
|
0.048333
|
0.005117
|
|
|
|
|
|
(0.02441)
|
(0.00428)
|
(0.00412)
|
|
|
|
|
|
D(KLSE)
|
0.043664
|
0.012689
|
-0.011415
|
|
|
|
|
|
Intégration financière internationale
face à une stratégie de diversification de
portefeuille
|
|
(0.01165)
|
(0.00204)
|
(0.00196)
|
|
D(KS11)
|
-0.050817
|
0.007380
|
0.006460
|
|
(0.01459)
|
(0.00256)
|
(0.00246)
|
|
D(NIKKEI225)
|
0.617942
|
0.189117
|
-0.106867
|
|
(0.16587)
|
(0.02909)
|
(0.02797)
|
|
D(SHANGCOMP)
|
0.057138
|
0.005305
|
-0.006260
|
|
(0.02383)
|
(0.00418)
|
(0.00402)
|
|
D(STI)
|
0.075049
|
0.000234
|
-0.012207
|
|
(0.01647)
|
(0.00289)
|
(0.00278)
|
|
4 Cointegrating Equation(s):
|
|
Log likelihood
|
-82347.63
|
Normalized cointegrating coefficients (standard error in
parentheses)
ALLORDINARIES BSE30 HANGSENG JKSE KLSE KS11 NIKKEI225 SHA
|
1.000000
|
0.000000
|
0.000000
|
0.000000
|
-2008.825
|
144.0679
|
-36.43127
|
89
|
|
|
|
|
(146.779)
|
(82.4024)
|
(5.17381)
|
(1
|
|
0.000000
|
1.000000
|
0.000000
|
0.000000
|
-3801.294
|
253.6615
|
-68.56055
|
17
|
|
|
|
|
(276.380)
|
(155.160)
|
(9.74208)
|
(3
|
|
0.000000
|
0.000000
|
1.000000
|
0.000000
|
-13631.65
|
960.6649
|
-246.3111
|
61
|
|
|
|
|
(995.644)
|
(558.958)
|
(35.0953)
|
(1
|
|
0.000000
|
0.000000
|
0.000000
|
1.000000
|
-460.6764
|
30.92076
|
-8.245222
|
20
|
|
|
|
|
(33.4247)
|
(18.7647)
|
(1.17818)
|
(4.
|
|
Adjustment coefficients (standard error in parentheses)
|
|
|
|
|
|
|
|
D(ALLORDINARIES)
|
-0.149243
|
-0.018545
|
0.025800
|
0.040741
|
|
|
|
|
(0.02431)
|
(0.00510)
|
(0.00434)
|
(0.04054)
|
|
|
|
|
D(BSE30)
|
-0.969601
|
-0.314584
|
0.178910
|
1.536155
|
|
|
|
|
(0.17356)
|
(0.03643)
|
(0.03099)
|
(0.28944)
|
|
|
|
|
D(HANGSENG)
|
1.361758
|
0.116228
|
-0.266092
|
0.983060
|
|
|
|
|
(0.16067)
|
(0.03373)
|
(0.02869)
|
(0.26794)
|
|
|
|
|
D(JKSE)
|
-0.043866
|
0.036839
|
0.011256
|
-0.445819
|
|
|
|
|
(0.02448)
|
(0.00514)
|
(0.00437)
|
(0.04082)
|
|
|
|
|
D(KLSE)
|
0.038539
|
0.008196
|
-0.009015
|
0.032617
|
|
|
|
|
(0.01171)
|
(0.00246)
|
(0.00209)
|
(0.01952)
|
|
|
|
|
|
|
|
|
|
D(KS11)
|
-0.037284
|
0.019242
|
0.000124
|
0.000534
|
|
(0.01443)
|
(0.00303)
|
(0.00258)
|
(0.02407)
|
|
D(NIKKEI225)
|
0.572929
|
0.149662
|
-0.085794
|
-1.192548
|
|
(0.16711)
|
(0.03508)
|
(0.02984)
|
(0.27869)
|
|
D(SHANGCOMP)
|
0.064483
|
0.011743
|
-0.009698
|
-0.092301
|
|
(0.02399)
|
(0.00504)
|
(0.00428)
|
(0.04001)
|
|
D(STI)
|
0.072133
|
-0.002322
|
-0.010841
|
0.025459
|
|
(0.01661)
|
(0.00349)
|
(0.00297)
|
(0.02771)
|
|
5 Cointegrating Equation(s):
|
|
Log likelihood
|
-82299.76
|
|
Normalized cointegrating coefficients (standard error in
parentheses)
|
ALLORDINARIES
|
BSE30
|
HANGSENG
|
JKSE
|
KLSE
|
KS11
|
NIKKEI225
|
SHA
|
|
1.000000
|
0.000000
|
0.000000
|
0.000000
|
0.000000
|
0.395232
|
-0.104617
|
-0.
|
|
|
|
|
|
(0.18084)
|
(0.01056)
|
(0.
|
|
0.000000
|
1.000000
|
0.000000
|
0.000000
|
0.000000
|
-18.21000
|
0.180279
|
0.
|
|
|
|
|
|
(1.45748)
|
(0.08509)
|
(0.
|
|
0.000000
|
0.000000
|
1.000000
|
0.000000
|
0.000000
|
-14.28136
|
0.197344
|
0.
|
|
|
|
|
|
(1.24055)
|
(0.07243)
|
(0.
|
|
0.000000
|
0.000000
|
0.000000
|
1.000000
|
0.000000
|
-2.027176
|
0.085435
|
0.
|
|
|
|
|
|
(0.19152)
|
(0.01118)
|
(0.
|
|
0.000000
|
0.000000
|
0.000000
|
0.000000
|
1.000000
|
-0.071521
|
0.018084
|
-0.
|
|
|
|
|
|
(0.04057)
|
(0.00237)
|
(0.
|
|
Adjustment coefficients (standard error in parentheses)
|
|
|
|
|
|
|
|
D(ALLORDINARIES)
|
-0.209490
|
-0.014553
|
0.014535
|
0.027303
|
-0.195803
|
|
|
|
(0.02933)
|
(0.00519)
|
(0.00532)
|
(0.04049)
|
(0.11861)
|
|
|
|
D(BSE30)
|
-0.803650
|
-0.325582
|
0.209938
|
1.573168
|
-2.834192
|
|
|
|
(0.21036)
|
(0.03725)
|
(0.03814)
|
(0.29043)
|
(0.85082)
|
|
|
|
D(HANGSENG)
|
0.943991
|
0.143913
|
-0.344203
|
0.889882
|
-3.168266
|
|
|
|
(0.19373)
|
(0.03431)
|
(0.03512)
|
(0.26747)
|
(0.78357)
|
|
|
|
D(JKSE)
|
-0.047115
|
0.037054
|
0.010648
|
-0.446544
|
0.029048
|
|
|
|
(0.02969)
|
(0.00526)
|
(0.00538)
|
(0.04099)
|
(0.12009)
|
|
|
|
D(KLSE)
|
0.045667
|
0.007723
|
-0.007682
|
0.034207
|
-0.700527
|
|
|
|
|
|
|
|
|
|
(0.01419)
|
(0.00251)
|
(0.00257)
|
(0.01960)
|
(0.05741)
|
|
D(KS11)
|
-0.009264
|
0.017385
|
0.005363
|
0.006783
|
-0.175560
|
|
(0.01745)
|
(0.00309)
|
(0.00316)
|
(0.02409)
|
(0.07057)
|
|
D(NIKKEI225)
|
0.839946
|
0.131966
|
-0.035869
|
-1.132993
|
-0.780720
|
|
(0.20225)
|
(0.03582)
|
(0.03667)
|
(0.27924)
|
(0.81804)
|
|
D(SHANGCOMP)
|
0.031962
|
0.013898
|
-0.015779
|
-0.099554
|
0.533271
|
|
(0.02906)
|
(0.00515)
|
(0.00527)
|
(0.04012)
|
(0.11752)
|
|
D(STI)
|
0.140903
|
-0.006880
|
0.002017
|
0.040797
|
0.019949
|
|
(0.01985)
|
(0.00351)
|
(0.00360)
|
(0.02740)
|
(0.08028)
|
|
6 Cointegrating Equation(s):
|
|
Log likelihood
|
-82261.61
|
|
|
Normalized cointegrating coefficients (standard error in
parentheses)
|
ALLORDINARIES
|
BSE30
|
HANGSENG
|
JKSE
|
KLSE
|
KS11
|
NIKKEI225
|
SHA
|
|
1.000000
|
0.000000
|
0.000000
|
0.000000
|
0.000000
|
0.000000
|
-0.120703
|
-0.
|
|
|
|
|
|
|
(0.01067)
|
(0.
|
|
0.000000
|
1.000000
|
0.000000
|
0.000000
|
0.000000
|
0.000000
|
0.921444
|
0.
|
|
|
|
|
|
|
(0.11853)
|
(0.
|
|
0.000000
|
0.000000
|
1.000000
|
0.000000
|
0.000000
|
0.000000
|
0.778610
|
0.
|
|
|
|
|
|
|
(0.10298)
|
(0.
|
|
0.000000
|
0.000000
|
0.000000
|
1.000000
|
0.000000
|
0.000000
|
0.167943
|
0.
|
|
|
|
|
|
|
(0.01520)
|
(0.
|
|
0.000000
|
0.000000
|
0.000000
|
0.000000
|
1.000000
|
0.000000
|
0.020995
|
-0.
|
|
|
|
|
|
|
(0.00237)
|
(0.
|
|
0.000000
|
0.000000
|
0.000000
|
0.000000
|
0.000000
|
1.000000
|
0.040701
|
-0.
|
|
|
|
|
|
|
(0.00704)
|
(0.
|
|
Adjustment coefficients (standard error in parentheses)
|
|
|
|
|
|
|
|
D(ALLORDINARIES)
|
-0.204531
|
-0.016598
|
0.013643
|
0.030326
|
-0.175978
|
-0.073860
|
|
|
(0.02986)
|
(0.00569)
|
(0.00541)
|
(0.04062)
|
(0.12073)
|
(0.07064)
|
|
|
D(BSE30)
|
-0.628118
|
-0.397976
|
0.178355
|
1.680137
|
-2.132483
|
-0.626154
|
|
|
(0.21261)
|
(0.04055)
|
(0.03854)
|
(0.28925)
|
(0.85960)
|
(0.50300)
|
|
|
D(HANGSENG)
|
1.026289
|
0.109971
|
-0.359011
|
0.940033
|
-2.839273
|
0.972267
|
|
|
(0.19693)
|
(0.03755)
|
(0.03569)
|
(0.26792)
|
(0.79619)
|
(0.46590)
|
|
|
|
|
|
|
|
|
|
|
D(JKSE)
|
-0.046834
|
0.036938
|
0.010597
|
-0.446372
|
0.030173
|
0.057300
|
|
(0.03024)
|
(0.00577)
|
(0.00548)
|
(0.04114)
|
(0.12226)
|
(0.07154)
|
|
|
D(KLSE)
|
0.039631
|
0.010213
|
-0.006596
|
0.030529
|
-0.724658
|
-0.023427
|
|
|
(0.01443)
|
(0.00275)
|
(0.00262)
|
(0.01963)
|
(0.05833)
|
(0.03414)
|
|
|
D(KS11)
|
0.001775
|
0.012833
|
0.003377
|
0.013510
|
-0.131431
|
-0.413938
|
|
|
(0.01769)
|
(0.00337)
|
(0.00321)
|
(0.02407)
|
(0.07154)
|
(0.04186)
|
|
|
D(NIKKEI225)
|
1.073199
|
0.035767
|
-0.077838
|
-0.990850
|
0.151731
|
0.457850
|
|
|
(0.20297)
|
(0.03871)
|
(0.03679)
|
(0.27614)
|
(0.82062)
|
(0.48019)
|
|
|
D(SHANGCOMP)
|
0.032052
|
0.013861
|
-0.015795
|
-0.099500
|
0.533631
|
0.148432
|
|
|
(0.02960)
|
(0.00564)
|
(0.00536)
|
(0.04026)
|
(0.11965)
|
(0.07002)
|
|
|
D(STI)
|
0.133252
|
-0.003724
|
0.003393
|
0.036135
|
-0.010634
|
0.079051
|
|
|
(0.02018)
|
(0.00385)
|
(0.00366)
|
(0.02746)
|
(0.08160)
|
(0.04775)
|
|
|
7 Cointegrating Equation(s):
|
|
Log likelihood
|
-82244.81
|
|
|
|
|
|
Normalized cointegrating coefficients (standard error in
parentheses)
|
|
|
|
|
|
|
ALLORDINARIES
|
BSE30
|
HANGSENG
|
JKSE
|
KLSE
|
KS11
|
NIKKEI225
|
SHA
|
|
1.000000
|
0.000000
|
0.000000
|
0.000000
|
0.000000
|
0.000000
|
0.000000
|
0.
|
|
|
|
|
|
|
|
(0.
|
|
0.000000
|
1.000000
|
0.000000
|
0.000000
|
0.000000
|
0.000000
|
0.000000
|
-3.
|
|
|
|
|
|
|
|
(0.
|
|
0.000000
|
0.000000
|
1.000000
|
0.000000
|
0.000000
|
0.000000
|
0.000000
|
-2.
|
|
|
|
|
|
|
|
(0.
|
|
0.000000
|
0.000000
|
0.000000
|
1.000000
|
0.000000
|
0.000000
|
0.000000
|
-0.
|
|
|
|
|
|
|
|
(0.
|
|
0.000000
|
0.000000
|
0.000000
|
0.000000
|
1.000000
|
0.000000
|
0.000000
|
-0.
|
|
|
|
|
|
|
|
(0.
|
|
0.000000
|
0.000000
|
0.000000
|
0.000000
|
0.000000
|
1.000000
|
0.000000
|
-0.
|
|
|
|
|
|
|
|
(0.
|
|
0.000000
|
0.000000
|
0.000000
|
0.000000
|
0.000000
|
0.000000
|
1.000000
|
4.
|
|
|
|
|
|
|
|
(0.
|
|
Adjustment coefficients (standard error in parentheses)
|
|
|
|
|
|
|
|
D(ALLORDINARIES) -0.205035
|
-0.017172
|
0.011042
|
0.021448
|
-0.151340
|
-0.075712
|
0.
|
|
|
|
|
|
|
|
(0.
|
|
(0.02984)
|
(0.00570)
|
(0.00570)
|
(0.04106)
|
(0.12185)
|
(0.07060)
|
|
D(BSE30)
|
-0.629794
|
-0.399883
|
0.169709
|
1.650622
|
-2.050579
|
-0.632310
|
0.
|
|
(0.21259)
|
(0.04064)
|
(0.04065)
|
(0.29256)
|
(0.86815)
|
(0.50299)
|
(0.
|
|
D(HANGSENG)
|
1.022118
|
0.105226
|
-0.380517
|
0.866623
|
-2.635555
|
0.956955
|
-0.
|
|
(0.19669)
|
(0.03760)
|
(0.03761)
|
(0.27067)
|
(0.80320)
|
(0.46536)
|
(0.
|
|
D(JKSE)
|
-0.047271
|
0.036441
|
0.008345
|
-0.454059
|
0.051505
|
0.055697
|
-0.
|
|
(0.03022)
|
(0.00578)
|
(0.00578)
|
(0.04159)
|
(0.12343)
|
(0.07151)
|
(0.
|
|
D(KLSE)
|
0.039815
|
0.010423
|
-0.005646
|
0.033775
|
-0.733665
|
-0.022750
|
-0.
|
|
(0.01442)
|
(0.00276)
|
(0.00276)
|
(0.01985)
|
(0.05890)
|
(0.03412)
|
(0.
|
|
D(KS11)
|
0.001742
|
0.012796
|
0.003209
|
0.012936
|
-0.129837
|
-0.414058
|
-0.
|
|
(0.01770)
|
(0.00338)
|
(0.00338)
|
(0.02435)
|
(0.07226)
|
(0.04187)
|
(0.
|
|
D(NIKKEI225)
|
1.075661
|
0.038569
|
-0.065139
|
-0.947504
|
0.031444
|
0.466891
|
-0.
|
|
(0.20290)
|
(0.03879)
|
(0.03879)
|
(0.27922)
|
(0.82858)
|
(0.48007)
|
(0.
|
|
D(SHANGCOMP)
|
0.033384
|
0.015376
|
-0.008930
|
-0.076065
|
0.468600
|
0.153320
|
-0.
|
|
(0.02942)
|
(0.00562)
|
(0.00563)
|
(0.04049)
|
(0.12014)
|
(0.06961)
|
(0.
|
|
D(STI)
|
0.132885
|
-0.004142
|
0.001498
|
0.029666
|
0.007318
|
0.077702
|
-0.
|
|
(0.02017)
|
(0.00385)
|
(0.00386)
|
(0.02775)
|
(0.08235)
|
(0.04771)
|
(0.
|
|
8 Cointegrating Equation(s):
|
|
Log likelihood
|
-82241.77
|
|
|
|
|
|
Normalized cointegrating coefficients (standard error in
parentheses)
|
|
|
|
|
|
|
ALLORDINARIES
|
BSE30
|
HANGSENG
|
JKSE
|
KLSE
|
KS11
|
NIKKEI225
|
SHA
|
|
1.000000
|
0.000000
|
0.000000
|
0.000000
|
0.000000
|
0.000000
|
0.000000
|
0.
|
|
0.000000
|
1.000000
|
0.000000
|
0.000000
|
0.000000
|
0.000000
|
0.000000
|
0.
|
|
0.000000
|
0.000000
|
1.000000
|
0.000000
|
0.000000
|
0.000000
|
0.000000
|
0.
|
|
0.000000
|
0.000000
|
0.000000
|
1.000000
|
0.000000
|
0.000000
|
0.000000
|
0.
|
|
0.000000
|
0.000000
|
0.000000
|
0.000000
|
1.000000
|
0.000000
|
0.000000
|
0.
|
|
0.000000
|
0.000000
|
0.000000
|
0.000000
|
0.000000
|
1.000000
|
0.000000
|
0.
|
|
|
|
|
|
|
|
0.
|
|
0.000000
|
0.000000
|
0.000000
|
0.000000
|
0.000000
|
0.000000
|
1.000000
|
|
0.000000
|
0.000000
|
0.000000
|
0.000000
|
0.000000
|
0.000000
|
0.000000
|
1.
|
|
Adjustment coefficients (standard error in parentheses)
|
|
|
|
|
|
|
|
D(ALLORDINARIES)
|
-0.206264
|
-0.016977
|
0.011102
|
0.022424
|
-0.152480
|
-0.075669
|
0.
|
|
(0.03023)
|
(0.00576)
|
(0.00571)
|
(0.04124)
|
(0.12193)
|
(0.07060)
|
(0.
|
|
D(BSE30)
|
-0.594264
|
-0.405514
|
0.167981
|
1.622394
|
-2.017626
|
-0.633556
|
0.
|
|
(0.21529)
|
(0.04099)
|
(0.04066)
|
(0.29372)
|
(0.86837)
|
(0.50278)
|
(0.
|
|
D(HANGSENG)
|
1.055895
|
0.099873
|
-0.382159
|
0.839787
|
-2.604228
|
0.955770
|
-0.
|
|
(0.19918)
|
(0.03792)
|
(0.03762)
|
(0.27174)
|
(0.80338)
|
(0.46515)
|
(0.
|
|
D(JKSE)
|
-0.042558
|
0.035694
|
0.008116
|
-0.457804
|
0.055876
|
0.055531
|
-0.
|
|
(0.03061)
|
(0.00583)
|
(0.00578)
|
(0.04176)
|
(0.12346)
|
(0.07148)
|
(0.
|
|
D(KLSE)
|
0.042008
|
0.010075
|
-0.005752
|
0.032032
|
-0.731631
|
-0.022827
|
-0.
|
|
(0.01461)
|
(0.00278)
|
(0.00276)
|
(0.01993)
|
(0.05892)
|
(0.03411)
|
(0.
|
|
D(KS11)
|
0.004071
|
0.012426
|
0.003096
|
0.011085
|
-0.127676
|
-0.414139
|
-0.
|
|
(0.01792)
|
(0.00341)
|
(0.00339)
|
(0.02445)
|
(0.07229)
|
(0.04186)
|
(0.
|
|
D(NIKKEI225)
|
1.046323
|
0.043218
|
-0.063713
|
-0.924195
|
0.004234
|
0.467920
|
-0.
|
|
(0.20550)
|
(0.03912)
|
(0.03881)
|
(0.28036)
|
(0.82887)
|
(0.47991)
|
(0.
|
|
D(SHANGCOMP)
|
0.039456
|
0.014414
|
-0.009225
|
-0.080890
|
0.474231
|
0.153107
|
-0.
|
|
(0.02979)
|
(0.00567)
|
(0.00563)
|
(0.04064)
|
(0.12015)
|
(0.06956)
|
(0.
|
|
D(STI)
|
0.134764
|
-0.004440
|
0.001407
|
0.028173
|
0.009061
|
0.077636
|
-0.
|
|
(0.02043)
|
(0.00389)
|
(0.00386)
|
(0.02787)
|
(0.08239)
|
(0.04770)
|
(0.
|
VECM
Vector Error Correction Estimates
Date: 05/30/11 Time: 12:33
Sample (adjusted): 5 1250
Included observations: 1250 after adjustments Standard errors in
( ) & t-statistics in [ ]
Cointegrating Eq: CointEqi
ALLORDINARIES(-1) 1.000000
BSE30(-1) 0.196338
(0.03513)
[ 5.58864]
HANGSENG(-1) -0.230075
(0.03310)
[-6.95054]
JKSE(-1) 0.850115
(0.24692)
[ 3.44292]
KLSE(-1) -10.48760
(0.74455)
[-14.0859]
KS11(-1) -0.867554
(0.42662)
[-2.03353]
NIKKEI225(-1) -0.231648
(0.02326)
[-9.95861]
SHANGCOMP(-1) 0.433636
(0.07780)
[ 5.57358]
STI(-1) 2.182948
(0.28198)
|
|
|
|
|
|
|
|
|
C
|
[ 7.74150]
4094.793
|
|
|
|
|
|
|
D(ALLORDINA
|
|
|
|
|
|
|
|
Error Correction:
|
RIES)
|
D(BSE30)
|
D(HANGSENG)
|
D(JKSE)
|
D(KLSE)
|
D(KS11)
|
D
|
|
CointEq1
|
-0.017282
|
-0.131434
|
0.411378
|
0.032290
|
0.062065
|
0.020746
|
|
|
(0.00981)
|
(0.07147)
|
(0.06502)
|
(0.01028)
|
(0.00467)
|
(0.00591)
|
|
|
[-1.76194]
|
[-1.83892]
|
[ 6.32738]
|
[ 3.14152]
|
[ 13.2910]
|
[ 3.50876]
|
[
|
|
D(ALLORDINARIES(-1))
|
-0.648577
|
0.523284
|
-0.224502
|
-0.047129
|
-0.078627
|
-0.028931
|
-
|
|
(0.03069)
|
(0.22363)
|
(0.20343)
|
(0.03216)
|
(0.01461)
|
(0.01850)
|
|
|
[-21.1337]
|
[ 2.33993]
|
[-1.10361]
|
[-1.46547]
|
[-5.38138]
|
[-1.56385]
|
[
|
|
D(ALLORDINARIES(-2))
|
-0.401180
|
0.644307
|
-0.169185
|
-0.121554
|
-0.085849
|
-0.030494
|
-
|
|
(0.03429)
|
(0.24984)
|
(0.22726)
|
(0.03593)
|
(0.01632)
|
(0.02067)
|
|
|
[-11.7011]
|
[ 2.57890]
|
[-0.74444]
|
[-3.38320]
|
[-5.25932]
|
[-1.47546]
|
[
|
|
D(ALLORDINARIES(-3))
|
-0.212269
|
0.482392
|
-0.096007
|
0.079158
|
-0.086553
|
0.068994
|
|
|
(0.02966)
|
(0.21612)
|
(0.19659)
|
(0.03108)
|
(0.01412)
|
(0.01788)
|
|
|
[-7.15710]
|
[ 2.23204]
|
[-0.48835]
|
[ 2.54694]
|
[-6.12966]
|
[ 3.85907]
|
[
|
D(BSE30(-1)) 0.006037 -0.691396 0.005537 -0.001906 -0.001786
0.000130
(0.00429) (0.03127) (0.02845) (0.00450) (0.00204) (0.00259)
[ 1.40666] [-22.1082] [ 0.19464] [-0.42382] [-0.87429] [ 0.05034]
[
D(BSE30(-2)) 0.000574 -0.540992 0.061736 0.009528 -0.001787
3.54E-05
(0.00458) (0.03340) (0.03038) (0.00480) (0.00218) (0.00276)
[ 0.12530] [-16.1988] [ 2.03215] [ 1.98388] [-0.81913] [ 0.01281]
[
D(BSE30(-3)) 0.004268 -0.332318 0.038310 0.001209 -0.002117
-0.002325
(0.00395) (0.02881) (0.02621) (0.00414) (0.00188) (0.00238)
[ 1.07943] [-11.5347] [ 1.46183] [ 0.29186] [-1.12480] [-0.97557]
[
D(HANGSENG(-1)) -0.010067 -0.042574 -0.563062 0.001247 0.011978
0.000200
(0.00475) (0.03458) (0.03146) (0.00497) (0.00226) (0.00286)
[-2.12133] [-1.23108] [-17.8991] [ 0.25070] [ 5.30147] [ 0.06975]
[
D(HANGSENG(-2)) -0.008102 -0.054421 -0.367188 3.25E-06 0.006897
-0.000853
(0.00508) (0.03699) (0.03365) (0.00532) (0.00242) (0.00306)
[-1.59585] [-1.47104] [-10.9113] [ 0.00061] [ 2.85338] [-0.27886]
[
D(HANGSENG(-3)) -0.001812 -0.007216 -0.169047 0.004764 0.003167
0.004027 -
(0.00445) (0.03242) (0.02949) (0.00466) (0.00212) (0.00268)
[-0.40735] [-0.22258] [-5.73190] [ 1.02181] [ 1.49496] [ 1.50154]
[
D(JKSE(-1)) -0.001479 1.129301 -0.605538 -0.607721 0.003231
0.031138
(0.03030) (0.22081) (0.20086) (0.03175) (0.01443) (0.01827)
[-0.04882] [ 5.11431] [-3.01472] [-19.1381] [ 0.22397] [ 1.70467]
[
D(JKSE(-2)) -0.009444 -0.041734 -0.333934 -0.367369 -0.011184
0.004415
(0.03344) (0.24368) (0.22166) (0.03504) (0.01592) (0.02016)
[-0.28243] [-0.17127] [-1.50651] [-10.4834] [-0.70247] [ 0.21902]
[
D(JKSE(-3)) 0.004917 0.179374 -0.128975 -0.155022 -0.010925
-0.006684
(0.02928) (0.21336) (0.19408) (0.03068) (0.01394) (0.01765)
[ 0.16794] [ 0.84070] [-0.66453] [-5.05235] [-0.78369] [-0.37870]
[
D(KLSE(-1)) -0.180497 -0.379257 4.380679 0.435628 -0.279480
0.245694
(0.09899) (0.72136) (0.65618) (0.10374) (0.04713) (0.05967)
[-1.82333] [-0.52575] [ 6.67602] [ 4.19936] [-5.92998] [ 4.11727]
[
D(KLSE(-2)) -0.138371 0.898484 2.513913 0.483563 -0.159616
0.162138
(0.08846) (0.64460) (0.58636) (0.09270) (0.04211) (0.05332)
[-1.56423] [ 1.39386] [ 4.28733] [ 5.21652] [-3.79000] [ 3.04062]
[
D(KLSE(-3)) -0.114223 0.150938 1.239412 0.177168 -0.066914
0.108560
(0.06706) (0.48867) (0.44452) (0.07027) (0.03193) (0.04042)
[-1.70328] [ 0.30888] [ 2.78823] [ 2.52110] [-2.09582] [ 2.68548]
[
D(KS11(-1)) -0.073844 -1.020135 0.980640 -0.057213 -0.005239
-0.722083 -
(0.04836) (0.35241) (0.32057) (0.05068) (0.02302) (0.02915)
[-1.52690] [-2.89473] [ 3.05907] [-1.12893] [-0.22754] [-24.7688]
[
D(KS11(-2)) -0.047981 -0.281880 0.433435 -0.038299 0.007127
-0.449274 -
(0.05567) (0.40564) (0.36899) (0.05833) (0.02650) (0.03356)
[-0.86193] [-0.69490] [ 1.17465] [-0.65655] [ 0.26891] [-13.3886]
[
D(KS11(-3)) -0.037238 -0.170908 0.187575 -0.028723 0.008190
-0.223785 -
(0.04774) (0.34790) (0.31647) (0.05003) (0.02273) (0.02878)
[-0.77997] [-0.49125] [ 0.59271] [-0.57411] [ 0.36030] [-7.77570]
[
D(NIKKEI225(-1)) -0.005322 0.059736 0.126654 0.010138 0.011704
0.003899 -
(0.00443) (0.03226) (0.02934) (0.00464) (0.00211) (0.00267)
[-1.20220] [ 1.85184] [ 4.31630] [ 2.18553] [ 5.55351] [ 1.46130]
[
D(NIKKEI225(-2)) 0.009241 0.039673 0.097802 0.004527 0.006924
0.003061 -
(0.00484) (0.03525) (0.03206) (0.00507) (0.00230) (0.00292)
[ 1.91055] [ 1.12557] [ 3.05039] [ 0.89303] [ 3.00654] [ 1.04997]
[
D(NIKKEI225(-3)) 0.003736 0.002131 0.083205 -0.002591 0.001383
0.006269 -
(0.00414) (0.03018) (0.02746) (0.00434) (0.00197) (0.00250)
[ 0.90201] [ 0.07059] [ 3.03048] [-0.59694] [ 0.70130] [ 2.51060]
[
D(SHANGCOMP(-1)) 0.275524 1.460187 0.290867 -0.009179 0.003767
0.027456 -
(0.03005) (0.21898) (0.19920) (0.03149) (0.01431) (0.01812)
[ 9.16842] [ 6.66799] [ 1.46019] [-0.29147] [ 0.26327] [ 1.51561]
[
D(SHANGCOMP(-2)) 0.039401 -0.795413 -0.434941 -0.054484 -0.017841
-0.037005 -
(0.03142) (0.22895) (0.20827) (0.03293) (0.01496) (0.01894)
[ 1.25403] [-3.47411] [-2.08838] [-1.65477] [-1.19266] [-1.95382]
[
D(SHANGCOMP(-3)) 0.029752 -0.512194 -0.353870 -0.012373 0.004600
-0.080497 -
(0.03115) (0.22700) (0.20649) (0.03264) (0.01483) (0.01878)
[ 0.95506] [-2.25635] [-1.71374] [-0.37904] [ 0.31013] [-4.28668]
[
D(STI(-1)) 0.045249 0.652464 -1.052226 0.034744 -0.047883
-0.071795
(0.04624) (0.33692) (0.30648) (0.04845) (0.02201) (0.02787)
[ 0.97867] [ 1.93656] [-3.43330] [ 0.71709] [-2.17524] [-2.57592]
[
D(STI(-2)) 0.038708 0.055075 -0.590828 -0.013887 -0.047490
-0.093401
(0.05052) (0.36812) (0.33486) (0.05294) (0.02405) (0.03045)
[ 0.76623] [ 0.14961] [-1.76441] [-0.26233] [-1.97453] [-3.06711]
[
D(STI(-3)) 0.024115 -0.185761 -0.292175 0.080433 -0.026362
-0.055093
(0.04348) (0.31682) (0.28819) (0.04556) (0.02070) (0.02621)
[ 0.55467] [-0.58633] [-1.01382] [ 1.76539] [-1.27358] [-2.10210]
[
C 0.825267 19.48715 11.72583 2.462879 0.674493 1.318499 -
(7.15917) (52.1688) (47.4550) (7.50225) (3.40844) (4.31562)
|
[ 0.11527]
|
[ 0.37354]
|
[ 0.24709]
|
[ 0.32829]
|
[ 0.19789]
|
[ 0.30552]
|
[
|
|
R-squared 0.388153
|
0.460749
|
0.328087
|
0.307668
|
0.455971
|
0.420654
|
|
|
Adj. R-squared 0.374076
|
0.448342
|
0.312628
|
0.291739
|
0.443454
|
0.407325
|
|
|
Sum sq. resids 77676235
|
4.12E+09
|
3.41E+09
|
85299295
|
17606558
|
28226022
|
|
|
S.E. equation 252.6381
|
1840.969
|
1674.628
|
264.7448
|
120.2796
|
152.2929
|
|
|
F-statistic 27.57354
|
37.13688
|
21.22313
|
19.31527
|
36.42899
|
31.55877
|
|
|
Log likelihood -8646.146
|
-11120.81
|
-11002.82
|
-8704.469
|
-7721.440
|
-8015.480
|
-
|
|
Akaike AIC 13.92479
|
17.89697
|
17.70757
|
14.01841
|
12.44051
|
12.91249
|
|
|
Schwarz SC 14.04414
|
18.01632
|
17.82691
|
14.13775
|
12.55986
|
13.03183
|
|
|
Mean dependent 0.482825
|
8.362552
|
5.920722
|
1.226549
|
0.332014
|
0.537408
|
-
|
|
S.D. dependent 319.3287
|
2478.629
|
2019.866
|
314.5798
|
161.2283
|
197.8205
|
|
|
Determinant resid covariance (dof adj.)
|
3.76E+46
|
|
|
|
|
|
|
Determinant resid covariance
|
3.04E+46
|
|
|
|
|
|
|
Log likelihood
|
-82592.82
|
|
|
|
|
|
|
Akaike information criterion
|
133.0061
|
|
|
|
|
|
Schwarz criterion 134.1173
Causalité
Pairwise Granger Causality Tests Date: 05/30/11 Time: 12:33
Sample: 1 1250
Lags: 2
|
Null Hypothesis:
|
Obs
|
F-Statistic
|
Prob.
|
|
BSE30 does not Granger Cause ALLORDINARIE
|
1156
|
4.36975
|
0.0129
|
|
ALLORDINARIE does not Granger Cause BSE30
|
|
1.23135
|
0.2923
|
|
HANGSENG does not Granger Cause ALLORDINARIE
|
1194
|
1.84859
|
0.1579
|
|
ALLORDINARIE does not Granger Cause HANGSENG
|
|
38.3245
|
7.E-17
|
|
JKSE does not Granger Cause ALLORDINARIE
|
1156
|
1.66814
|
0.1891
|
|
ALLORDINARIE does not Granger Cause JKSE
|
|
1.04722
|
0.3512
|
|
KLSE does not Granger Cause ALLORDINARIE
|
1180
|
0.68969
|
0.5019
|
|
ALLORDINARIE does not Granger Cause KLSE
|
|
2.99836
|
0.0503
|
|
KS11 does not Granger Cause ALLORDINARIE
|
1184
|
4.37455
|
0.0128
|
|
ALLORDINARIE does not Granger Cause KS11
|
|
22.0771
|
4.E-10
|
|
NIKKEI225 does not Granger Cause ALLORDINARIE
|
1148
|
3.24389
|
0.0394
|
|
ALLORDINARIE does not Granger Cause NIKKEI225
|
|
1.09710
|
0.3342
|
|
SHANGCOMP does not Granger Cause ALLORDINARIE
|
1208
|
0.92917
|
0.3952
|
|
ALLORDINARIE does not Granger Cause SHANGCOMP
|
|
3.40938
|
0.0334
|
|
STI does not Granger Cause ALLORDINARIE
|
1215
|
3.22035
|
0.0403
|
|
ALLORDINARIE does not Granger Cause STI
|
|
6.78728
|
0.0012
|
|
HANGSENG does not Granger Cause BSE30
|
1125
|
0.18878
|
0.8280
|
|
BSE30 does not Granger Cause HANGSENG
|
|
10.0392
|
5.E-05
|
|
JKSE does not Granger Cause BSE30
BSE30 does not Granger
Cause JKSE
|
1104
|
26.1222
3.74719
|
8.E-12
0.0239
|
|
KLSE does not Granger Cause BSE30
|
1123
|
6.16689
|
0.0022
|
|
BSE30 does not Granger Cause KLSE
|
|
14.4001
|
7.E-07
|
|
KS11 does not Granger Cause BSE30
|
1126
|
5.91924
|
0.0028
|
|
BSE30 does not Granger Cause KS11
|
|
10.6902
|
3.E-05
|
|
NIKKEI225 does not Granger Cause BSE30
|
1097
|
13.5299
|
2.E-06
|
|
BSE30 does not Granger Cause NIKKEI225
|
|
9.46306
|
8.E-05
|
|
SHANGCOMP does not Granger Cause BSE30
|
1146
|
1.49760
|
0.2241
|
|
BSE30 does not Granger Cause SHANGCOMP
|
|
0.63645
|
0.5294
|
|
STI does not Granger Cause BSE30
|
1144
|
10.4669
|
3.E-05
|
|
BSE30 does not Granger Cause STI
|
|
8.51489
|
0.0002
|
|
JKSE does not Granger Cause HANGSENG
|
1127
|
0.04334
|
0.9576
|
|
HANGSENG does not Granger Cause JKSE
|
|
10.6329
|
3.E-05
|
|
KLSE does not Granger Cause HANGSENG
|
1159
|
0.66933
|
0.5122
|
|
HANGSENG does not Granger Cause KLSE
|
|
0.35523
|
0.7011
|
|
KS11 does not Granger Cause HANGSENG
|
1167
|
4.90611
|
0.0076
|
|
HANGSENG does not Granger Cause KS11
|
|
5.58634
|
0.0039
|
|
NIKKEI225 does not Granger Cause HANGSENG
|
1129
|
0.14080
|
0.8687
|
|
HANGSENG does not Granger Cause NIKKEI225
|
|
3.07827
|
0.0464
|
|
SHANGCOMP does not Granger Cause HANGSENG
|
1185
|
0.73570
|
0.4794
|
|
HANGSENG does not Granger Cause SHANGCOMP
|
|
26.9575
|
4.E-12
|
|
STI does not Granger Cause HANGSENG
|
1190
|
6.76244
|
0.0012
|
|
HANGSENG does not Granger Cause STI
|
|
35.0109
|
2.E-15
|
|
KLSE does not Granger Cause JKSE
|
1147
|
6.22995
|
0.0020
|
|
JKSE does not Granger Cause KLSE
|
|
20.6849
|
1.E-09
|
168
|
KS11 does not Granger Cause JKSE
JKSE does not Granger Cause
KS11
|
1132
|
21.8117
5.61677
|
5.E-10
0.0037
|
|
NIKKEI225 does not Granger Cause JKSE
|
1101
|
11.6705
|
1.E-05
|
|
JKSE does not Granger Cause NIKKEI225
|
|
27.0345
|
3.E-12
|
|
SHANGCOMP does not Granger Cause JKSE
|
1138
|
2.72690
|
0.0659
|
|
JKSE does not Granger Cause SHANGCOMP
|
|
9.70568
|
7.E-05
|
|
STI does not Granger Cause JKSE
|
1155
|
34.9244
|
2.E-15
|
|
JKSE does not Granger Cause STI
|
|
2.90162
|
0.0553
|
|
KS11 does not Granger Cause KLSE
|
1148
|
3.49125
|
0.0308
|
|
KLSE does not Granger Cause KS11
|
|
1.55831
|
0.2109
|
|
NIKKEI225 does not Granger Cause KLSE
|
1117
|
14.8676
|
4.E-07
|
|
KLSE does not Granger Cause NIKKEI225
|
|
1.11680
|
0.3277
|
|
SHANGCOMP does not Granger Cause KLSE
|
1166
|
3.20636
|
0.0409
|
|
KLSE does not Granger Cause SHANGCOMP
|
|
2.12369
|
0.1201
|
|
STI does not Granger Cause KLSE
|
1184
|
5.68529
|
0.0035
|
|
KLSE does not Granger Cause STI
|
|
9.23541
|
0.0001
|
|
NIKKEI225 does not Granger Cause KS11
|
1126
|
0.39173
|
0.6760
|
|
KS11 does not Granger Cause NIKKEI225
|
|
15.2059
|
3.E-07
|
|
SHANGCOMP does not Granger Cause KS11
|
1173
|
2.05511
|
0.1285
|
|
KS11 does not Granger Cause SHANGCOMP
|
|
4.53632
|
0.0109
|
|
STI does not Granger Cause KS11
|
1176
|
4.59313
|
0.0103
|
|
KS11 does not Granger Cause STI
|
|
80.5746
|
2.E-33
|
|
SHANGCOMP does not Granger Cause NIKKEI225
|
1134
|
4.40740
|
0.0124
|
|
NIKKEI225 does not Granger Cause SHANGCOMP
|
|
1.71246
|
0.1809
|
|
STI does not Granger Cause NIKKEI225
|
1145
|
17.7276
|
3.E-08
|
|
NIKKEI225 does not Granger Cause STI
|
|
2.09098
|
0.1240
|
|
STI does not Granger Cause SHANGCOMP
|
1197
|
3.15280
|
0.0431
|
SHANGCOMP does not Granger Cause STI 3.08377 0.0462
| 
