Article 15 :
EFFECT OF STIMULATION INTENSITY AND INTRACOCHLEAR SITE
ON ELECTRIC AUDITORY
BRAINSTEM RESPONSES IN HUMAN USING A MULTICHANNEL
COCHLEAR IMPLANT WITH A
VARIABLE DURATION PULSE
S. Gallégo, J Durrant, E. Truy, C Berger Vachon, L.
Collet
Article soumis
Dans un premier temps, l'article décrit un protocole
qui permet d'étudier les PEAEP en fonction de l'intensité et du
site de stimulation électrique de la cochlée. Après avoir
démontré l'intérêt de l'utilisation de la
durée de l'impulsion pour coder l'intensité, l'article montre
qu'il est possible d'obtenir des PEAEP sur tous les sujets testés et que
les caractéristiques des ondes (II, III et V) sont similaires à
celles obtenues avec d'autres types d'implants cochléaires.
L'étude statistique montre que l'amplitude des ondes croit
avec l'intensité de stimulation (codée par la durée de
l'impulsion) et croit lorsque l'on se dirige vers des stimulations apicales.
Par contre les latences sont des paramètres peu
dépendants de l'intensité de stimulation (en durée de
l'impulsion).
La latence de l'onde V (et l'intervalle III-V) varie en fonction
du site de stimulation. Elle décroît légèrement
lorsque l'on se dirige vers des stimulations apicales.
L'estimation par les PEAEP des fonctions de sonies des sujets
implantés et en particulier des seuils de détection et de confort
est un sujet intéressant pour l'aide au réglage de l'implant.
EFFECT OF STIMULATION INTENSITY AND INTRACOCHLEAR SITE
ON
ELECTRIC AUDITORY BRAINSTEM RESPONSES IN HUMAN USING A
MULTICHANNEL
COCHLEAR IMPLANT WITH A VARIABLE DURATION PULSE.
S Gallégo (1,2), JD Durrant (1,3), E Truy (4), C
Berger-Vachon (1), L Collet (1,4).
1- UPRESA 5020 CNRS Laboratory
2- MXM Laboratory
3-Departments of Communication Science and Disorders and
Otolaryngology, Pittsburgh
4- ORL Dept, Ed. Herriot Hospital
ABSTRACT : The Electrical Auditory Brainstem
Response (EABR) elicited via a cochlear implant is an interesting tool for
analysis of retrocochlear mechanisms, i.e. the impontine brainstem. In this
paper, EABRs were studied with respect to stimulation intensity and the excited
part of the cochlea. The parameter used to control the stimulus intensity was
the pulse duration. Latencies were found to be rather stable, which was not
seen in all previously reported studies (namely variations of waves III and V).
This tact can be explained by the shape of the stimulating pulse. By judicious
choice of the stimulus waveform, synchronization of the fibers is enhanced by
making it more difficult for firing on the negative phase of the pulse.
Amplitudes of waves II, III, and V were slightly increased with the stimulation
intensity. EABR latencies and intentais (mostly wave V and III-V interval)
decreased from base to apex. This might reflect a compensatory mechanism to the
propagation delay from the base to apex in a normal cochlea. The amplitudes of
wave II, III, and V also were increased from base to apex; this may be linked
to cells'density along the cochlea which progressively increases from the base
to the end of the first cochlear turn.
Key words: Cochlear implant, EABR,
characterization, pulse duration, level effect, site effect.
INTRODUCTION
Auditory Brainstem Responses (ABRs) recorded, on the surface
of the scalp, presumably reflect (primarily) the propagation of nerve action
potentials through the lower auditory pathway, involving multiple synaptic
delays, decussation(s) of fibers, and discontinuities of the volume conductor.
First described in the literature in 1967 (Sohmer and Feinmesser, 1967), the
ABR comprises up to 7 waves with in a time window of approximately 10
milliseconds (Jewett and Williston, 1971). Each wave cornes from the activity
of one or more generators distributed along the afferent auditory system, from
the cochlea to the middle geniculate body (Moore, 1987a,b). The electrically
elicited ABR has met with increased interest. The Electric Auditory Brainstem
Response (EABR) has been studied in animais and humans alike and compared
systematically to acoustically evoked ABRs (e.q. see Gyo and Yanagihara, 1980
and Starr and Brackman, 1979, respectively). Wave latency has been found to
vary little with stimulus intensity, unlike the acoustic ABR. The acoustically
elicited response is well-known to demonstrate a pronounced latency-intensity
function which, in turn, is considered to reflect the influence of cochlear
propagation (Don and Eggermont, 1978, 1993, 1994, Gorga et al, 1988). In any
event, the place encoding mechanism precludes scrutiny of place-specific
stimulation without the influence of wave-propagation-based latency effects.
The EABR potentially allows the characterization of the activation of the
auditory system without such `distortion'.
The development of cochlear implant (House et al, 1976;
Michelson, 1971; Simmons, 1966) opened the door to the study of the human EABR
since the implanted electrode can be used as a stimulator (Starr and Brackman,
1979). Van den Honert and Stypulkowski, 1986 characterized the effects of the
stimulus intensity in patients fitted with a single-channel cochlear implant.
Results showed that EABRs are generated in a similar manner to acoustical ABR
with no significant difference found for the interpeak intervals 11411, III-V,
II-V. Recent comparisons between acoustically and electrically evoked ABR - in
the same patients with brainstem implant (stimulation at the level of the
cochlear nucleus) confirms this result for wave III, and V (Waring, 1992,
1995). Nevertheless, authors emphasize the technical difficulties of recording
the EABR. First, electrical stimulation can introduce myogenic and facial
nerve responses (Fifer and Novak, 1990; Van den Honert and Stypulkowski,
1986;
Waring, 1992). Furthermore, the stimulation artifact itself is
very difficult to remove from EABR recordings. Nevertheless, studies performed
in animais (Van den Honert and Stypulkowski, 1984, 1986) have shown
correlations between EABR and ABR recordings and revealed the relation between
the number of surviving cells in the spiral ganglion and EABR magnitude (Hall,
1990), as had been assumed in the human (Brightwell et al, 1985; Smith and
Simmons, 1983).
The arrivai of a new generation of cochlear implants (Clark et
al, 1981; Eddington, 1980) made possible EABR recordings utilizing
place-specific stimulation (Abbas and Brown, 1988), albeit constrained by the
spread of electrical excitation due to the transmission-cable-like
electroanatomy of the cochlea. Results, however, were not remarkably different
when different parts of the cochlea were stimulated (Abbas and Brown, 1991a).
In any event, it proved difficult to reliably record EABR for basal stimulation
of the cochlea (Shallop et al, 1993), and it appeared that wide intervals on
the cochlea were being stimulated (Abbas and Brown, 1991a) or for recording
problem (locking of the fibers and signal to noise ratio) to study only wave V
and not waves II and III (Miller et al, 1993).
In these studies, the pulse amplitude was adjusted to modify
the stimulation intensity. Consequently, when the intensity of electrical
current was raised, the portion of the cochlea stimulated also was increased,
i.e. via the spread of excitation. It is a wellestablished property of neurons
in general (see Colombo and Parkins, 1987, for review and model) that stimulus
duration also can used to increase the stimulation intensity. This has also be
demonstrated specifically for auditory neurons (Pfingt et al, 1991). The
inherent advantage of manipulating stimulus pulse duration, versus intensity,
is that the length of the stimulated interval on the cochlea can be held
constant. The use of the pulse duration to modify the stimulus intensity allows
better phase locking of the auditory nerve fibers, at least when stimulus
intensity is kept low. In the case, the shorter the duration of the pulse is,
the better the synchronization becomes. Poor locking of the fibers in very low
loudness, when constant duration pulse are used, can explain the poor
correlations seen between the perceptual threshold and EABR appearance in human
cochlear implantees (Shallop et al, 1991; Mason et aI, 1994; Brown et al, 1994)
and in the cat (Smith et aI, 1994).
The purpose of this report is to characterize in detail the
EABR obtained in such subjects with short pulse duration, generally below 100
ps, according to stimulus intensity (i.e. duration, with amplitude held
constant) and the putative cochlear segment excited. This method of stimulation
(i.e. short duration with amplitude constant) enhances EABR recording (measure
of waves II, III and V) by better synchronization.
MATERIAL & METHODS Subjects
Eleven implantes, fitted with the DIGISONIC cochlear implant
(CI), participated in this study (8 males and 3 females, aged from 3.5 to 69
years).
The French DIGISONIC MXM cochlear implant
The DX10 DIGISONIC (Beliaeff et al, 1994, Chouard et al, 1995,
Gallégo et al, 1997c) is a 15-channel, transcutaneous, cochlear implant
device made by the French firm, MXM (06, Vallauris). It comprises an external
and an internai part. The external part incorporates the emitting antenna which
is juxtaposed the internai receiving antenna (i.e. forming the transcutaneous
link between the two parts). The internai part is thus totally implanted. It is
composed of the receiver package and a 15electrode array. The electrodes (0.5
mm) are equally spaced (0.7 mm) along the first turn of the cochlea and
typically are situated from 5 to 20 mm, with respect to the round window.
Indeed, performance of patients implanted with this 15-channel device
demonstrates its effectivenessin stimulating the neurons of the spiral
ganglion, namely (for interest of this report) to permit them to accurately
scale pitch (Truy et al, 1995).
The mode of stimulation is common ground (Gallégo et
al, 1997d,e) --the activated electrode goes positive initially white the others
are set to ground. Capacitive coupling ensures a net zero current. Pulse
duration ranged from 5 to 310 ps, but was generally bellow 100 ps. The
stimulating current ranged from 0.25 to 3 mA but was generally below 1 mA.
These specifications (possibility to modify pulse duration or
pulse amplitude) make this device adapted to EABR recording.
As shown in figure 1, by the 'in vitro' recording of a stimulus pulse (i.e. in
normal saline solution), the stimulus pulse demonstrates a large asymmetry.
Adjustment of the coupling capacities, however, permits perfect equalization of
positive and negative charges, averting the problem of electrolysis of the
metallic electrode in an ionic solution (Gallégo et ai, submittted a).
Most of the fibers are synchronized by the positive phase of the stimulation,
facilitated also by the sharp onset (Rattay and Motz, 1987). The response to
the negative phase (usually below 100 ps) is minimal (Moxon, 1971; Javel et al,
1986, 1987). This is due to the asymmetry, specifically the short duration of
the positive phase, which is much less than the nerve refractory period (Abbas
and Brown, 1991b; Kasper, 1991).
Figure 1: Electrical model of the DIGISONIC
stimulation inside the cochlea. Cochlea was represented by a resistance only
(Clopton and Spelman, 1982); the admitted value was about 1 kohm. The voltage
average value, on the resistance, is equal to zero. In vitro measurements
showed that positive and negative phases of the stimulating wave were not
symmetrical. Fibers are likely to be mostly synchronized by the positive phase
of the wave.
In order to perform EABR recording, special equipment
(DIGISTIM) was developed by MXM which supplants the external part of the
implant. DIGISTIM is powered by batteries, PC controlled through an
optoisolated serial port. This system generates pulses with adjustable
parameters (electrode selection, pulse amplitude, pulse duration, and
stimulation frequency). It is also possible to synchronize an external device,
such as an evoked response test system.
EABR recording
A commercial evoked response measurement system (Nicolet Path
Finder II was used to record the EABR. The recording montage was as follows:
forehead at hair line connected to the noninverting input of the recording
amplifier; earlobe connected to the inverting input; the contralateral earlobe
connected to ground. Recording parameters were similar to those utilized for
conventional ABR recordings. Full scale sensitivity was +1- 50 pV. To minimize
distortion of the tracing due to the stimulation artifact, a wide bandpass
(0.2-8000 Hz) was employed (Van den Honert and Stypulkowski, 1986). The
analysis window was 10 ms (512 points). The sampling frequency was more than
twice the maximum frequency seen in the ABR, avoiding aliasing, and allowed an
efficient rejection of the noise (Gronfors and Juhola, 1995). Each
time-ensemble average derived from over 512 repetitions of the stimulus. In
order to assess the reproducibility of the response averages, three
replications were made per stimulus condition. Stimulation repetition rate was
60 Hz. (Note: the line frequency in France is 50 Hz; in this case, therefore,
the repetition rate discouraged, rather than encouraged, phase coherence with
line-frequency noise.). The frequency of stimulation also is elevated (
relative to pates that optimize ABR waveform definition under acoustic
stimulation) but, contrary to the situation for acoustic ABR, this does not
pose a significant problem. Adaptation under electric stimulation actually is
more likely a rate whose period is that of neural refractory period (Abbas and
Brown, 1991; Kasper, 1991). Each electrode was tested over 16 stimulus
magnitudes (i.e. pulse durations) in descending order from the most
comfortable. Let Min be the perception threshold, and Max, the comfortable
magnitude (at 300 Hz). The stimulus was never over 1.5x(Max-Min)+Min. When the
16x3 recordings were completed, the data were transferred to a floppy disk,
after ASCII conversion. The data were fed to a personal computer for further
processing.
Digital filtering and signal processing
To improve the quality of the recorded curves several
digital-signal processing were algorithms were applied. The details of the
filter function applied are proprietary (MXM), but the principles of design of
the filter and its performance are described by - Gallego et al- (1997b,
submitted b). A hrigh-quality EABR recording is desirable for
the most reliable measurements of latencies and amplitudes. In
order to evaluate EABR reproducibility (for a given electrode and stimulation
intensity) a 3x3 crosscorrelation matrix was constructed with the time-ensemble
averages. This provided a statistical basis by which reject a response which
appeared to be an outiiner, relative to the others (i.e. for a given subject
and condition). Criteria for selection and other details are discussed below.
Following analysis of reproducibility, a grand average was computed from the
accepted (individual) averages.
|
Literature
|
LII (ms)
|
LIII (ms)
|
LV (ms)
|
dll-Ill (ms)
|
dIII-V (ms)
|
|
Van den Honert and
|
1.20
|
2.10
|
4.09
|
0.95
|
1.83
|
|
Stypulkowski, 1986
|
(s.d. 0.14)
|
(s.d. 0.15)
|
(s.d. 0.26)
|
(s.d. 0.16)
|
(s.d. 0.17)
|
|
Abbas and Brown,
1988
|
1.36
(s.d. 0.19)
|
1.99
(s.d. 0.23)
|
3.99
(s.d. 0.37)
|
0.63
|
2.00
|
|
Kasper et al, 1992
|
1.38
|
2.16
|
3.94
|
0.75
|
1.79
|
|
(s.d. 0.09)
|
(s.d. 0.18)
|
(s.d. 0.22)
|
|
(s.d. 0.17)
|
|
Gallégo et al, 1996
|
NG
|
1.96
|
3.91
|
NG
|
1.95
|
|
|
(s.d. 0.10)
|
(s.d. 0.16)
|
|
|
Table I: Average values and standard deviations
in EABR latencies (Van den Honert and stypulkowski, 1986; Abbas and Brown,
1988; Kasper et al, 1992 ; Gallégo et al, 1996). NG=not given.
Assessment of EABR reproducibility is important in deciding
whether or not a given wave is present. ln conventional/clinical ABR
assessments, reproducibility typically is based upon a visual comparison of
test and retest averages (Arnold, 1985), but this method subjective is
completely. To augment the decision process, namely by supplementing visual
inspection with a statistical tool, cross-correlation coefficients were
calculated, and zero-crossing of the first derivative of the waveform was used
for picking peak per se. Thus involved several rules or constraints based upon
preliminary studies (Gallégo et al, 1996, 1997a) and results obtained by
other EABR researchers (Van den Honert and Stypulkowski, 1986; Abbas and Brown,
1988; Shallop et al, 1991; Kasper et al, 1992). Collectively, these results led
to the rules for the detection and evaluation of waves II, III, and V latencies
and interpeak intervals (table I), as follows: the latency of wave II must be
from 0.8 to 1.6 ms; the latency of wave III, between 1.5 to 2.5 ms; latency of
wave V, from 3.4 to 4.5 ms; interval 11411, from 0.6 to 1.3 ms; interval III-V,
from 1.4 to 2.2 ms. Finally, wave amplitudes were
measured peak-to-peak, from a given vertex-positive peak to the
following negative peak or through.
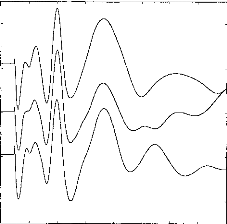
Figure 2 shows examples of response averages that appear to be
highly reproducible upon visual inspection. Indeed, latencies of waves Ila,
Ilb, III, and V appear to be essentially invariant across test runs. The 3x3
cross-correlation matrix confirms the visual impression. Wave amplitudes also
are significantly correlated (p<0.001) if the cross-correlation coefficient
is higher than 0.2. Intercorrelation is over 0.2 (p<0.001) and the following
values have been obtained: 1-2:0.911; 1-3:0.862; 2-3:0.847. The mathematical
processing shows a slight shift between the three curves: 1-2:Ops; 1- 3:20ps;
2-3:20ps. Consequently visual examination and mathematical processing lead to a
reliable and objective assessment of EABR reproducibility.
0 1 2 3 4 5 6 7 8
Figure 2: EABR reproducibility with three
identical stimulations. Intercorrelation and time shift between
the curves
are: 1-2: 0.911, dT 1-2: 0.00ms ; 1-3: 0.862, dT, 1-3: 0.02ms ; 2-3: 0.0.847,
dT 2-3: 0.02ms.
Amplitude- Intensity Trade-off
Intensity of stimulation, again, can be varied by adjusting
amplitude and/or duration of the stimulus pulse (Columbo and Parkins, 1987).
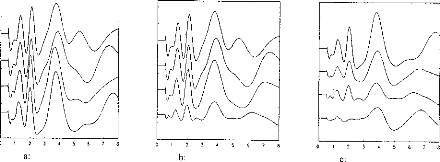
These parameters can be controlled independently by the DIGISONIC (fig 3a).
Figure 3a shows EABRs evoked by pulses eliciting the same loudness percept in
the test subject. In this case, several combinations of amplitudes and
durations; the EABRs are quite similar. However,
when amplitude alone is adjusted (figure 3b), an additional
wave at 5 ms can be seen with pulses of high amplitude (short duration). In
figure 3c, EABRs are plotted for different pulse durations. In figure 3b, no
added waves are seen for high intensities. (Note: Loudnesses were the same for
corresponding plots of figures 3b and 3c.)
4
3
0 I 2
b:
8
8
3
7
1 2
C.
a:
Figure 3: (3a) Stimulation loudness was
equivalent for the 4 curves; with different amplitude and pulse duration. (3b)
Thresholds for several stimulation levels (the amplitude of the pulse was
modified; stimulation decreased from 1 to 4). (3c) Thresholds for several
stimulation levels when the duration of the pulse was modified. Stimulation had
the same loudness for corresponding recordings on 3b and 3c (eg 1 and 1).
LII
LIII
LV
d11-111
dIII-V
dll-V
dllp-Iln
dIllp-Illn
dVp-Vn
Ail
A111
AV
Mean
|
Std. dev.
|
1
|
2
|
3
|
|
1.278
|
0.172
|
NS
|
NS
|
NS
|
|
2.050
|
0.180
|
NS
|
NS
|
NS
|
|
3.864
|
0.276
|
***
|
NS
|
NS
|
|
0.772
|
0.062
|
***
|
NG
|
NG
|
|
1.814
|
0.139
|
NS
|
NG
|
NG
|
|
2.586
|
0.156
|
NG
|
NG
|
NG
|
|
0.340
|
0.026
|
NG
|
NG
|
NG
|
|
0.571
|
0.075
|
NG
|
NG
|
NG
|
|
1.074
|
0.102
|
NG
|
NG
|
NG
|
|
0.249
|
0.099
|
NG
|
NG
|
NG
|
|
0.442
|
0.157
|
NG
|
NG
|
NG
|
|
0.590
|
0.163
|
NG
|
NG
|
NG
|
Table II: EABR mean values and standard
deviations on 11 subjects, and comparison with other studies (1:Van den Honert
and Stypulkowski, 1986; 2:Abbas and Brown, 1988; Kasper et al, 1992). In same
cases, our results were compared with other findings using a comparison of mean
values (NS: difference being not significant; ***: statistical difference
p<0.05; NG: not measured).
RESULTS
EABR--General Characteristics
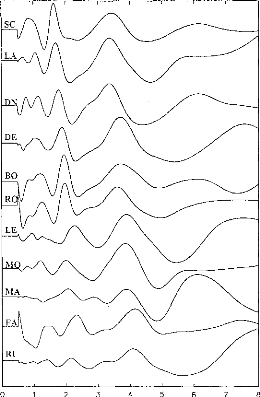
Figure 4: EABR recordings on 11 subjects.
Stimulation was on the most apical electrode in the cochlea. Waves II,
III and V can be seen for each subject. Y-scale was changed for each
subject.
EABRs were recorded successfully for all implantees and all
the electrodes leading to an auditory sensation. Ail in all, 58 electrodes were
considered, and more than 1000 EABR recording were examined. Figure 4 gives an
example of the typical EABR recording obtained. Ail EABR demonstrated similar
characteristics with peak latencies as follows: wave II from 0.97 ms to 1.53
ms; wave III from 1.80 and 2.36 ms; wave V from 3.50 and 4.32 ms. An 11x11
correlation matrix of the recordings shown on figure 4 indicates that, apart
from some shifts between the subjects, EABRs turn out to be similar across
implantees.t If subject SC is Leen as_ a_
reference, following shifts and correlations have been
observed: LA:dT=40ps, R=0.83; DN:dT=20ps, R=0.93; DE:dT=260ps, R=0.77;
BO:dT=300ps, R=0.89; RO:dT=300ps, R=0.94; LE:dT=580ps, R=0.74; MO:dT=400ps,
R=0.86; MA:dT=340ps, R=0.54; FA:dT=700ps, R=0.91; RI:dT=650ps, R=0.65.) Thus,
EABR recordings appeared to be reliable and similar among subjects (R>0.2;
p<0.001). Average values of latencies, amplitudes, and intervals between
wave II, III, and V are indicated on table II. A comparison with the values
obtained by others researchers did not show significant differences (Van den
Honert and Stypulkowski, 1986; Abbas and Brown, 1988; Kasper et al, 1992).
Effects of stimulation lntensity (Duration)
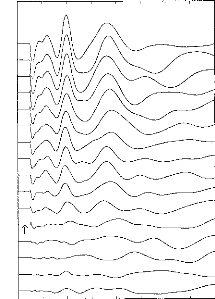
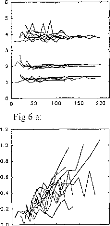
Figure 5: Recordings for one subject: 16
decreasing stimulation intensities were taken. The arrow shows the patient's
subjective auditory threshold. Stimulation intensity was controlled by the
pulse duration.
In this study again, the primary parameter of stimulus
intensity of interest was the
pulse duration. Figure 5 provides exemplary
data. EABRs could be seen with a very
low stimuli. EABR wave latencies seemed not to be affected by
the stimulus intensity. On the other hand, amplitudes were closely linked to
the stimulus intensity, as expected. Indeed, the visual detection level of the
EABRs was found to correspond well with the threshold of the auditory
perception of the stimulus (indicated by the arrow in Fig. 5).
150 200
100
52
3.5 3.0 2.5 2,0 1.5 1.0 0.5
0.0
0
Fig 6 b:
0.5
2.0
0.0
1.5
1.0
0.8
0.6
0.4
0
0 53
Fig 6 a:
1.2
0.2
1.0
0.0
6
5
3
4
2
"le
100
150 200
100 150 200
53
Intensity (us/cycle) Fig 6 f:
4.0
·
0.0
0
0 50
Fig 6 d:
100
150
200
3.0
2.5
2.0
1.5
1.0
0.5
0 50 1C0 150 200
Fig 6 c:
52 100 150 200
Intensity (us/cycle) Fig 6 e:
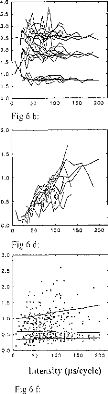
Figure 6: Subject BO: EABR modification with
the stimulation intensity given in ps.
(6a) wave II, III, and V latencies.
(6b) d11-111, dIII-V, and dll-V intervals.
(6c) wave II amplitude.
(6d) wave III amplitude.
(6e) wave V amplitude.
(6f) PII-N11, PIII-N111, PV-NV intervals.
Evolution of different EABR parameters, with respect to the
stimulation intensity, for a given subject (BO) and on several electrodes is
represented on figure 6. Below, p (positive) will indicate the (positive) peak
of the wave and n (negative) the valley. Absolute latencies and interpeak
intervals were nearly independent of the stimulus magnitude, particularly
Ilp-Iln and Illp-Illn. The Vp-Vn interval was observed to increase slightly
with increased stimulus intensity.
For each subject, we carried out multiple-linear regression
analyses among EABR parameters as a function of stimulus intensity and
electrode site. The second column of Table III provides the means and standard
deviation (latencies, interpeak intervals and amplitudes) for a change of 100
ps in pulse duration (corresponding to the approximate average dynamic range of
stimulation). The third column indicates which values are significantly
different from zero. It can be seen, for intense, that lengthening of 100 ps of
the stimulus pulse led to decrease of 106 ps of Pll latency. The changes in
amplitude for wave II, latency for wave II, and interpeak intervals II- III,
III-V, and II-V and not statistically significant. A significant increase of
the amplitude of wave III, and V also was seen. Latencies of wave III, & V
slightly, but significantly decreased with the stimulation (-106, -200, and
-156 ps respectively).
|
Effect of stimulation Intensity
|
Effect of Intracochlear Site
|
|
Variation per 100
psof pulse
duration
|
p
|
Variation per 15
mm of cochlea
|
p
|
|
LII (ms)
|
-0.212
|
NS
|
0.026
|
NS
|
|
LIII (ms)
|
-0.400
|
0.023
|
-0.022
|
NS
|
|
LV (ms)
|
-0.312
|
0.013
|
-0.181
|
<0.001
|
|
dl1-111(ms)
|
-0.106
|
0.053
|
-0.047
|
NS
|
|
dIII-V (ms)
|
0.008
|
NS
|
-0.157
|
0.004
|
|
dll-V (ms)
|
-0.102
|
NS
|
-0.161
|
NS
|
|
All (pA)
|
0.582
|
0.087
|
0.166
|
0.019
|
|
AIII (pA)
|
0.848
|
0.019
|
0.363
|
0.040
|
|
AV (pA)
|
0.912
|
0.011
|
0.366
|
0.075
|
Table III: Columns 3 and 5: Means and
standard deviations (latencies, interpeak intervals and amplitudes) by multiple
linear regression for a change of 100 ps in pulse duration and for a change of
15 mm in stimulation site. Columns 4 and 6: Comparison from zero of EABRs
variations.
Effects of Stimulated part of the Cochlea
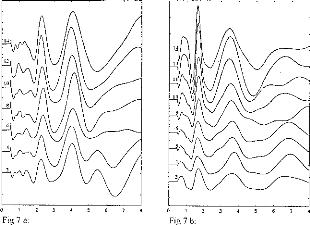
Figure 7: EABR recordings for several electrodes
stimulated with the same loudness, for 2 patients. Electrode 1 is basal and
electrode 15 is apical.
Figure 7a and 7b demonstrate typical trends in the effects of
stimulation electrode/channel, for stimili judged to have the same loudness.
The most basal electrode is 2 and the most apical is 14. It can be seen that
EABR waveforms were not modified by electrode number or, in effect, stimulus
site along the cochlea. Also, wave II, III, and V latencies were similar
regardless electrode activated. However, EABR amplitudes were systematically
increased when the electrode was moved from base to apex. Data presented in
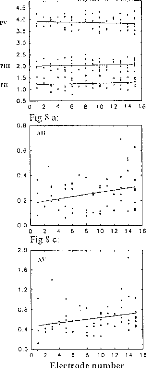
Figure 8 serve to characterize the effects electrode number, for all patients'
latencies, amplitudes, and interpeak intervals for waves (II, III,
and V). Each point represents the average of the values obtained for
different stimulation intensities, (one subject per electrode). The following
additional trends are evident:
-wave II latency was not modified with respect to the stimulated
zone (fig 8a); -wave V increases from apex to base (fig 8a);
-intervals dIII-V and dll-V decreased with stimulation Gloser to
the apex (fig
8b),
-wave II, III, and V amplitudes increased from base to apex (fig
8c, 8d, 8e), as noted before;
-PN intervals for waves II, III, and V were,
roughly constant (fig 8f).
dll-V
|
3.5
3.0
|
|
|
|
|
|
|
|
|
|
2.5
|
|
|
|
|
|
|
|
|
|
·
|
|
2.0
|
|
:
·
|
|
|
|
|
|
· .
|
|
|
|
1.5
|
|
:
|
·
|
|
dIll-V
|
|
|
|
|
|
|
1.0
|
|
|
|
|
|
|
|
|
|
|
|
0.5
|
|
|
|
|
|
0.0
|
|
|
|
|
|
6 8 10
|
12 14
|
16
|
|
0
|
|
|
Fig 8 b:
|
|
|
|
|
1.4
|
- AIII
|
|
|
|
|
1.2
|
|
|
|
|
|
1.0
|
|
|
|
|
|
0.8
|
|
.
|
·
·
|
|
|
0.6
|
|
.
·
· .
|
|
|
|
|
· a
|
|
· .
|
·
|
|
0.4
|
|
|
|
|
|
|
·
|
. .
·
·
|
|
|
|
0.2
|
|
|
|
|
|
0.0
|
|
|
|
|
|
6 8 10
|
12 14
|
16
|
|
|
|
Fig 8 d:
|
|
|
|
|
2.0
|
|
|
|
|
|
O PIII-NIII
|
O ru-sli
|
|
|
|
|
1.5
|
|
|
|
|
|
1.0
|
|
|
|
|
|
|
· :
|
·
·
·
|
·
|
|
|
|
·
·
|
· :
|
·
|
;
|
|
0.5
|
-
·
·
|
: ;
|
·
·
·
|
·
|
|
|
· :
|
· :
|
|
1
|
|
|
· ;
|
|
|
|
0.0
|
|
|
|
|
0 2 4 6 8 10 12 14 15
Electrode number
16
2 4 6 8 10 12 14
0.0
0 2 4
Fig 8 C:
2.0
6 8 10 12 14 16
Fig 8 a:
0.8
0.6
0.4
0.2
1.6
1.2
0.8
0.4
0.0
0 2 4 6 8 10 12 14 16
Electrode number
.
|
|
|
|
|
|
|
.
|
·
|
:
·
|
:
|
|
|
|
|
|
|
|
i
·
|
|
|
|
|
|
|
·
|
· :
|
·
|
.
·
|
:
|
· '
|
:
|
- .
|
|
|
.
|
|
|
|
|
|
|
|
.
|
.
|
|
|
|
° °
·
8
|
°
|
· :
|
|
|
°
|
: '
|
!
|
|
|
i 8
|
. .
|
|
|
·
·
.
|
i
|
|
·
8
|
° .
|
|
|
|
|
|
|
0.5
0
4.5
4
Pt' 4.0
3.5
3.0
2.5
PM 2.0
1.5
1.0
.tV
Fig 8 e: Fig 8 f:
Figure 8: EABR values, with respect to the electrode, for all
patients. (8a) waves II, III, and V latencies. (8b) d11-111, dIII-V, and dll-V
intervals. (8c) wave 11 amplitude. (8d) wave III amplitude. (8e) wave V
amplitude. (8f) PII-NII, PIII-N111, PV-NV intervals.
Here too linear regressions were calculated. There fourth
column of table III shows the mean and standard deviations of the EABR
measures (again, as a function of stimulus duration and electrode
site), for a change of 15 mm in stimulation site (corresponding to the depth of
penetration of the electrode array. The fifth column indicates which resuits
were significantly different from zero. It can be seen, for instance, that
lengthening of 15 mm of cochlea led to statistically significant increase
of 26 ps of Pli latency. A significant increase of the
amplitude of wave II, III also was seen. Latencies of wave V
and interval of waves III-V significantly decreased with the stimulation
site(-181, -157 ps). However, the changes of amplitude of wave V, latencies of
waves II and III, and interpeak intervals of waves II-III and II-V were not
statistically significant.
DISCUSSION
Latencies, amplitudes and intervals measured from waves II,
III, and V observed in this study are in good agreement with the values
obtained by other researchers (table I). EABRs are composed of at Ieast 3 waves
occurring within a time shorter than 6 ms. Wave II, with its bifid shape (Van
den Honert, 1986), was seen in all the subjects. Wave Ila is probably wave I
because its latency is similar to the auditory nerve compound action potential
latency (Brown and Abbas, 1990; Gantz et al, 1994). Wave III was observed to
have a relatively high amplitude and short duration. The IV- V complex was
wider than the other waves, as characteristic of the acoustically evoked
response. It has been suggested (Abbas and Brown, 1988, 1991a) that the
stimulation of the basal part of the cochlea triggers a wide spread excitation.
This was not seen with our technique.
Although EABRs stimulated in base of the cochlea are
difficult to record (Shallop et al, 1993), it was possible in this study to
obtain and label EABRs for all electrodes (within and across subjects) capable
of eliciting an auditory sensation. Consequently waves II, III, and V
latencies, amplitudes, and intervals were measured. We believe that the high
quality of our EABR recordings was due to the shape of the stimulation pulse
(asymmetry, sharp positive phase and short duration pulse for low-level),
leading to good synchronization, and our method of digital processing of the
data, leading to robust suppression of artifacts.
Average values calculated in our study were in agreement with
those given by other investigators. However, they may be far different from
usual values measured on healthy subjects as it seems likely that wave latency
reflects the effects of limited populations of primary auditory neurons and/or
auditory deprivation prior to implantation (Gallégo et al, submitted c).
For healthy subjects, waves latencies should be close of those seen for SC,
DN, and LA (L11=1.10ms, 1111=1.85 ms,
LV=3.55 ms). Regardless of the variability among subjects,
EABR shapes were reasonably stationary in time; intersubject correlation was
always higher than 0.2 (p<0.001).
Choice of Stimulus Parameters and Effects of Stimulus
Intensity/Duration
As stated earlier, electrical stimulation can be controlled
by two means, pulse amplitude (figure 3b) and duration (figure 3c). Amplitude
is the most commoniy used parameter in examining the EABR. The problem with
adjusting amplitude is that at high intensities, the spread of excitation
within in cochlea effectively increases and may even corne to involve the
vestibule and facial nerve. The use of the pulse duration bears several
advantages, as suggested earlier and verified by the results reported here. The
results in Figure 3 demonstrate the comparability of results obtained with
stimuli of the same intensity, regardless of parameters. However, for EABR,
when amplitude is high and duration short, a wave, probably myogenic (Fifer and
Novak, 1990), is seen with a latency of 5 ms approximately (e.g. see figure
3b). Consequently, the use of pulse duration, rather than magnitude to control
stimulation intensity is likely to improve the quality of the recording and to
simplify the interpretation. The results suggest further that, ineed, using
pulse duration, the stimulated zone on the cochlea remains constant. Even with
low-intensity stimulation (i.e. decreased duration), synchronization is
facilitated (fig. 3c).
Several authors (Allum et al, 1990; Abbas and Brown, 1991a;
Shallop et al, 1990, 1991, 1993) have found an increase in latency for low
levels of stimulation; others (Van den Honert and Stypulkowski, 1986; Kasper et
al, 1991, 1992) found latencies to be essentially invariant. None of the
studies considered pulse duration in order to control the stimulation. In our
work, stimulation duration had an average of 54.5ps (s.d. 36.25ps). The mean
range was around 100 ps. We observed a constant of latencies and interpeak
intervals with stimulation intensity (i.e. ranges were -212ps=- 16.5% for wave
II, -400ps= -19.5% for waves Ill, and -312ps= -8.1% for wave V).
Still other investigators have considered the influence of
shape of the stimulus pulse
(Rattay, 1987), the evoked response elicited by
the negative phase (Moxon, 1971;
Javel, 19861 and refractory period (Abbas
and Brown, 1991 b; Kasper et al, 1992).
Rattay showed that the steeper the slope of the electrical
pulses, the better the synchronization of the 8th nerve response. Both Moxon
and Javel noted that when the electrical stimulation biphasic pulse was wide,
auditory neurons could respond on the second phase. Durational effects also
relate to the refractory period of neurons. One of the consequences of this
phenomena is that EABR thresholds were correlated to perceptual thresholds
(Gallégo et al, 1996,1997a; Truy et al, 1997a,b) than with other
stimulation strategies (Shallop et ai, 1991, 1993; Brown et al, 1994; Mason et
al, 1994; Smith et al, 1994). Propagation speed appeared to be increased for
strong stimulation, but the variation is compared to ABR amplitude, and
intervals between the waves turned out to be unrelated to the stimulation
intensity.
Effect of Cochlear Region of stimulation
It has been noted (Black et al, 1983; O'Leary et al, 1985)
that with bipolar stimulation, the stimulated segment on the cochlea can be
very small (voltage distribution is divided by three for a distance from 2 to 4
mm). Studies in animais show a high correlation between the response and the
frequency-place excitation parameters in the inferior colliculus (Black and
Clark, 1980). Variation of latency, interpeak intervals and amplitudes of waves
II, Ill, and V versus the stimulated electrode were measured in the present
study (fig 6). The latency of wave II was not found to be dependent upon the
stimulated zone. Therefore there is no tonotopic influence upon the timing of
neural discharges reaching (i.e. unlike the case of acoustic ABR). This result
is in agreement with previous histological studies (Hinojosa et al, 1985;
Spoendlin et al, 1972, 1988 ; Moore, 1987a ; some extend, Spoendlin, 1989)
which failed to show any substantive/systematic variations in nerve fiber
diameter as a function of tonotopic origin in the cochlea. This also is
consistent with electrically stimulated single-unit responses (Kiang and Moxon,
1972).
Generally, wave V latency (in agreement with Miller et al,
1993) and the III-V interval was found to decrease from base to apex. Also,
information processing appeared to be faster, from the exit of the cochlear
nucleus to the last nuclei of the brain stem, for low-frequency compared to the
high-frequency places of stimulation. This apparent increased efficiency of
transmission along the brain stem amounted to roughly 0.18 ms (4.7%) for wave
V tatencies (cochlea to inferior colliculus) and 0.16 ms (8.8%) for
waves III-V interval (cochlear nucleus to inferior colliculus)
for a corresponding distance of 15 mm along the cochlea.
Wave amplitudes in this study were found to be higher with
more apicalward stimulation (end of the first turn); width of the waveform,
however, was roughly constant. It has been observed that the transfer functions
of the auditory nerve fibers is essentially the same from base and apex (Kiang
and Moxon, 1972). The modification of the amplitude cannot be explained by
desynchronization of the fibers. An explanation, however, can be offered via
results of the following studies: -in the human and in the cat a correlation
has been reported between EABR amplitude, and the number of cells in spiral
ganglion (Smith and Simmons, 1983; Hall, 1990); -in both the cat (Spoendlin,
1972) and in normal humans (Hinoja et al, 1985; Spoendlin and Schrott, 1988,
1989), histological studies have showed an increase of cell density in the
spiral ganglion, from the base to the end of the first cochlear turn. The low
amplitude of the waves, at the base, could be directly connected to a lower
number of cells on the spiral ganglion. For some subjects, however, the
amplitude did not vary monotonically from base to apex. The effect thus may
depend on the etiology of deafness, as since some authors noted a correlation
between number of spiral ganglion cells and the nature of the auditory loss
(e.q. Otte et al, 1978; Schmidt, 1985).
ACKNOWLEDMENTS
The authors acknowledge persons and institutions who
supported their work: the MXM company, the CIFRE, the Hospices Civils of Lyon,
the CNRS, the University of Lyon, professor Alain Morgon (head of the ORL
department), and the eleven implantees who participated in this study.
REFERENCE
Abbas PJ, Brown CJ. Electrically evoked brainstem
potentials in cochlear implant patients with multi-electrode stimulation. Hear
Res 1988 36:153-62
Abbas PJ, Brown CJ. Electrically evoked auditory
brainstem response: Growth of the response with current level. Hear Res 1991a
51:123-37
Abbas PJ, Brown CJ. Electrically evoked auditory
brainstem response: Refractory properties and strength duration functions. Hear
Res1991b 51:138-48.
Allum JHJ, Shallop JK, Hotz M, Pfaltz CR.
Characteristics of electrically evoked 'auditory' brainstem responses elicited
with the Nucleus 22-electrode intracochlear implant. Scand Audiol 1990
19:263-7
Arnold SA. Objective versus Visual Detection of the
Auditory Brain Stem Response. Ear Hear 1985 6(3):144-50
Beliaeff M, Dubus P, Leveau J-M, Repetto J-C, Vincent
P. Sound Signal Processing and
Stimulation Coding of the DIGISONIC DX10 15-Channel
Cochlear Implant. Advances in Cochlear Implant Ed Hochmair-Desoyer IJ &
Hochmair ES Innsbruck 1994 198-203
Black R, Clark GM. Differencial electrical excitation of
the auditory nerve. J Acous Soc Am 1980 67:868-74.
Black R, Clark G, Tong Y, Patrick J. Current
distributions in cochlear stimulation. Ann NY Acad Sci 1983
405:137-45
Brightwell A, Rothera M, Conway M, Graham J.
Evaluation of status of the auditory nerve: psychophysical test and ABR. Eds RA
Schindler & MM Merzenich Cochlear Implants Raven Press New York 1985
343-9
Brown CJ, Abbas PJ. Electrically evoked whole nerve
action potentials: Data from human cochlear implant users. J Acoust Soc Am 1990
88(3):1385-91
Brown JB, Abbas PJ, Fryauf-Bertschy H, Kelsay D,
Gantz BJ. Intraoperative and Postoperative Electrically Evoked Auditory Brain
Stem Responses in Nucleus Cochlear Implant Users: Implications for the Fitting
Process. Ear Hear 1994 15:168-76
Bruce JG, Brown CJ, Abbas PJ. Intraoperative measures of
electrically evoked auditory nerve compound action potential. Am J Otology 1994
15(2):137-44
Busby PA, Tong YC, Clark GM. Electrode position,
repetition rate, and speech perception by early- and late-deafened cochlear
implant patients. J Acoust Soc Am 1993 93(2):1058-67 Chouard CH, Ouayoun M,
Meyer B, Fugain C. Speech Coding Strategies of the DIGISONIC Fully Digitized
Cochlear Implant. Acta Otolaryngol (Stockh) 1995 115:264-8
Clark GM, Tong YC, Martin LFA. A multiple-channel
cochlear implant: an evaluation using closed-set spondaic words. J Laryngol
1981 95:461-4
Clark G, Shepherd R, Franz B, Dowell R, Tong Y et al.
The histopathology of the human temporal bone and auditory central nervous
system following cochlear implantation in patient. Acta Otolaryngol (Stockh)
1988 (suppl 448):1-65
Clopton B, Spelman F. Neural mechanisms relevant to the
design of an auditory prothesis: location and electrical characteristics. Ann
Otol Rhinol Laryngol 1982 91(sup98):9-14 Columbo J, Perkins CW. A model of
electrical excitation of the mammalian auditory nerve neuron. Hear Res 1987
31:287-312
Don M, Eggermont JJ. Analyses of click-evoked brainstem
potentials in man using high-pass noise masking. J Acoust Soc Am 1978
63(4):1084-98
Don M, Ponton CW, Eggermont JJ, Masuda A. Gender
differences in cochlear response time: An explanation for gender amplitude
differences in the unmasked auditory brain-stem response. J Acoust Soc Am 1993
94(4):2135-48
Don M, Ponton CW. Auditory brainstem response (ABR)
peak amplitude variability reflects
individuel differences in cochlear response times. J
Acoust Soc Am 1994 96(6):3476-91 Durrant JD. Fundamentals of sound generation.
Bases of Auditory Brain-Stem Evoked Responses (Ed EJ Moore) Grune et Stratton
Inc New York 1983 15-50
Eddington DK. Speech discrimination in deaf subjects
with cochlear implants. J Acoust Soc Am 1980 51:885-91
Eggermont J. Analysis of click-evoked brainstem
potentials in humans using high-pass noise masking.lI. Effect of click
intensity. J Acoust Soc Am 1980 68:1671-5
Fifer RC, Novak MA. Myogenic Influences on the
Electrical Auditory Brainstem Response (EABR) in Humans. Laryngoscope 1990
100:1180-4
Gallégo S, Micheyl C, Berger-Vachon C, Truy E,
Morgon A, Collet L. Ipsilateral ABR with cochlear implant. Acta Otolaryngol
(Stockh) 1996 116:228-33.
Gallégo S, Truy E, Morgon A, Collet L. EABRs and
surface potentials with a transcutaneous multielectrode cochlear implant. Acta
Otolaryngol (Stockh) 1997a 117:164-8.
Gallégo S, Collet L., Berger-Vachon C.
Electrically auditory brainstem responses (EABR) : contribution of a filter
adapted to the auditory system. J international federation for medical &
biomedical engineering, 1997b, 35 (suppl 1), 304.
Gallégo S, Garnier S, Berger-Vachon C. Traitement
du signal de parole pour sourds-profonds: l'implant cochléaire. Revue
d'électricité et d'électronique. 1997c, 8,
50-53.
Gallégo S, Collet L., Berger-Vachon C. A model
of electrical stimulation delivered by the Digisonic cochlear implant. J
international federation for medical & biomedical engineering, 1997d, 35
(suppl 1), 300.
Gallégo S, Lu BL, Berger-Vachon C. Modelling
of the electrical stimulation delivered by the DIGISONIC Multichannel cochlear
implant. Advance in Modelling & Simulation Eng 1997e, in press.
Gallégo S., Frachet B., Truy E., Collet L.
Cochlear implant performance and electrically auditory brainstem response
characteristics. (in press)
Gallégo S, Beliaeff M, Frachet B, Berger-Vachon
C, Collet L. Long-term change in threshold and
comfort levels and dynamics in Digisonic cochlear
implant bearers. Submitted a.
Gallégo S, Durrant J, Collet L., Berger-Vachon
C. Numeric time-variant filters adapted to the
recording of electrically auditory brainstem responses
(E-ABR). Submitted b.
Gallégo S, Truy E, Berger-Vachon C, Collet C.
Electrically auditory brainstem responses in cochlear implant assessment:
possibility and interest. Submitted c.
Gantz BJ, Brown CJ, Abbas PJ. Intraoperative measures of
ellectrically evoked auditory nerve compound action potential. Am J Otol 1994
15:2 137-44
Gorga MP, Kaminski JR, Beauchaine KA, Jesteadt W.
Auditory brainstem responses to tone bursts in normally hearing subjects. J
Speech Hear Res 1988 31:87-97
Greenwood DD. A cochlear frequency-position function
for several species-29 years later. J Acoust Soc Am 1990
87(6):2592-605
Gronfors T, Juhola M. Effect of sampling frequencies
and averaging resolution on medical
parameters of auditory brainstem responses. Comput Biol
Med 1995 25, 5:447-54
Gyo K, Yanagihara N. Electrically and acoustically
evoked brainstem responses in guinea pig.
Acta Otolaryngol (Stockh) 1980 90:25-31.
Hall RD. Estimation of surviving spiral ganglion cells
in the deaf rat using the electrically evoked auditory brainstem response. Hear
Res 1990 45:123-36
Hinojosa R, Seligsohn R, Lerner S. Ganglion cell counts
in the cochleae of patients with normal audiograms. Acta Otolaryngol (Stockh)
1985 99:8-13
House WF, Berliner K, Crary W, Graham M, Luckey R,
Norton N, Selters W, Tobin H, Urban J, Wexler M. Cochlear implants. An Otol
Rhinol Laryngol 1976 85(suppl 27):1-93
Javel E. Basic response properties of auditory nerve
fiber. Neurobiology of Hearing: The
Cochlea. 1986 Ed Altschuster RA, Bobbin RB, Hoffman DW.
Raven Press. New York.
Javel E, Tong Y, Shepherd B, Clark G. Responses of cat
auditory nerve fibers to biphasic electrical current pulses. Ann Otol Rhinol
Laryngol 1987 96(suppl 128):26-30
Jewett DL, Williston JS. Auditory evoked far-fields
averaged from the scalp of humans. Brain 1971 94:681-96
Kasper A, Pelizzone M, Montandon P. Electrically Evoked
Auditory Brainstem Responses in Cochlear Implant Patients. ORL 1992
54:285-94
Kasper A. Electrically Evoked Activity in Human Auditory
System. Thesis 1991 Genève.
Keitley EM. Frequency map of the spiral ganglion in the
cat. J Acoust Soc Am 1987 81(4):103642
Kiang NYS, Moxon EC. Physiological considerations in
artificial stimulation of the inner ear. Ann Otol Rhinol Laryngol 1972
81:714-31
Leake PA, Snyder RL. Topographic organisation of the
central projections of the spiral ganglion in cats. J Comp Neurol 1989
281:612-29
Mason S, Sheppard S, Garnham C, Lutman M, O'Donoghue,
Gibbin K. Improving the relationship of intraoperative EABR threshold to
T-level in young children receiving the Nucleus cochlear implant. Advances in
Cochlear Implant Ed Hochmair-Desoyer IJ & Hochmair ES 1994
44-49.
Michelson RP. Electrical stimulation of human cochlear:
A preliminary report. Arch Otolaryngol 1971 93(3):317
Miller CA, Abbas PJ, Brown CJ. Electrically evoked
auditory brainstem response to stimulation of different sites in the cochlea.
Hear Res 1993 66:130-42
Moore JK. The human auditory brainstem: A comparative
view. Hear Res 1987a 29:1-32
Moore JK. The human auditory brainstem as a generator of
auditory evoked potentials. Hear Res 1987b 29:33-43
Moxon EC. Neural and mechanical responses to electric
stimulation of the cat's inner ear. Thesis. 1971 MIT Cambridge,
Mass.
O'Leary S, Black R, Clark G. Current distributions in
the cat cochlea: a modelling and electrophysiological study. Hear Res 1985
18:273-81
Otte J, Schuknecht H, Kerr A. Ganglion cell populations
in normal and pathological human
cochleae. Implications for cochlear implantation.
Laryngoscope 1978 88:1231-46
Pfingst BE, De Haan DR, Holloway LA. Stimulus
features affecting psychophysical detection thresholds for electrical
stimulation of the cochlea.1: Phase duration and stimulus duration. J Acoust
Soc Am 1991 90(4):1857-66
Rattay F, Motz H. Stimulation of a multichannel nerve
array to pulse shapes produced by a single channel electrostimulation.
Perception 1987 16:769-76.
Rosbe KW, Burgess BJ, Glynn RJ, Nadol JB. Morphologic
evidence for three cell types in the human spiral ganglion. Hear Res 1996
93:120-7
Schmidt J. Cochlear neuronal populations in
developmental detects of the inner ear:
implications for cochlear implantation. Acta Otolaryngol
(Stockh) 1985 99:14-20
Shallop JK, Beiter AL, Goin DW, Mischke RE.
Electrically Evoked Auditory Brain Stem Responses (EABR) and Middle Latency
Responses (EMLR) Obtained from Patients with the Nucleus Multichannel Cochlear
Implant. Ear Hear 1990 11,1:5-15
Shallop JK, VanDyke L, Goin DW, Mischke RE.
Prediction of behavioral threshold and confort values for Nucleus 22-channel
implant patients from electrical auditory brain stem response test results. Ann
Otol Rhinol Laryngol 1991 100:896-8
Shallop JK. Objective electrophysiological measures from
cochlear implants patients. Ear Hear 1993 14:58-63
Simmons FB. Electrical stimulation of the auditory
nerve in man. Arch Otolaryngol 1966 84:2-54 Smith DW, Finley CC, Van den Honert
C van den, Olszyk VB, Konrad KEM. Behavioral and electrophysiological responses
to electrical stimulation in the cati. Absolute thresholds. Hear
Res 1994 81:1-10
Smith L, Simmons FB. Estimating eighth nerve survival by
electrical stimulation. Ann Otol Rhinol Laryngol 1983 92:19-23
Sohmer H, Feinmesser M. Cochlear action potentials
recorded from the external ear in man. Ann Otol Rhinol Laryngol 1967
76:427-35
Spoendlin H. Innervation densities of the cochleae. Acta
Otolaryngol (Stockh) 1972 73:235-48 Spoendlin H, Schrott A. The Spiral Ganglion
and the Innervation of the Human Organ of Corti. Acta Otolaryngol (Stockh) 1988
105:403-10
Spoendlin H, Schrott A. Analysis of the human auditory
nerve. Hear Res 1989 43:25-38
Starr A, Brackman DE. Brainstem potentials evoked by
electrical stimulation of the cochlea in human subjects. Ann Otol Rhinol
Laryngol 1979 88:550-60
Truy E, Gallégo S, Berger-Vachon C, Morgon A.
Multichannel cochlear implant in patients with ossified cochlea. Interest of
the optimization of frequential selectivity of speech signal with Digisonic
device. Proc IlIrd int Symp Transplants & implants in otology. Bordeaux
(France), June 10-14 1995. M portman, P. Boudard, D. Portman, pp.
399-402.
Truy E, Gallégo S, Channal JM, Collet L,
Morgon A. Correlation between electrical auditory brainstem response and
perceptual thresholds in Digisonic cochlear implant. Laryngoscope 1997a, 117:
in press.
Truy E, Gallégo S, Channal JM, Collet L,
Berger-Vachon C, Morgon A. Intérêt des potentiels
évoqués auditifs électriques du tronc
cérébral chez les patients porteurs d'un implant
cochléaire digisonic. Ann Otolaryngol Chir Cervicofac, 1997b, 114,
116-124.
Van den Honert C, Stypulkowski PH. Physiological
properties of the electrically stimulated auditory nerve.11. Single fiber
recording. Hear Res 1984 14:225-43
Van den Honert C, Stypulkowski PH. Characterization of
the electrically evoked auditory brainstem response (ABR) in cats and humans.
Hear Res 1986 21:109-26
Waring MD. Electrically evoked auditory brainstem
response monotoring of auditory brainstem
implant integrity during facial nerve tumor surgery.
Laryngoscope 1992 102:1293-5
Waring MD. Auditory brain-stem responses by electrical
stimulation of the cochlear nucleus in
human subjects. Electroenceph clin Neurophysiol 1995
96:338-47
Zapala DA, Gould HJ, Mendel MI. Place specific influence
on the wave I to V interpeak latency of the auditory brain-stem response. J
Acoust Soc Am 1992 92(6):3174-84
| 

