4.2.2.4. Cold trap
The stream leaving the dilutor cell contains not only
nitrogen, but also solute and probably solvent vapours. A cold trap serves as a
separation unit to ensure that the flow rate determined by the soap bubble
flow-meter is actually the one of nitrogen which is required in the infinite
dilution activity coefficient computation equation. Failure to condense solute
and solvent vapours will lead to inaccurate data. The cold trap as shown in
figure 4-2 consists of two chambers. The upper chamber (A) contains an
ice-acetone solution in which a 1/4 inch ID copper coil is completely immersed.
The outlet gas stream from the dilutor cell flows through the coils and ends
its path in the lower chamber (B) where the condensate is trapped. Nitrogen,
the only gaseous component after this process, rises up to exit through the
pipe (C) and makes its way to the soap bubble flow-meter (J). Valve (E) can be
opened to drain out the liquid captured in chamber (B).
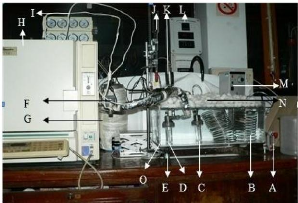
Photograph 4-2: Set-up of the inert gas
stripping apparatus. A-flow regulator; B-Coil tube
(Heat exchanger);
C-Presaturation cell; D- Dilutor cell; E-Magnetic stirrer; F-Sampling
valve;
G-Cold trap; H-GC apparatus; I-GC lines; J-Soap bubble flow-meter;
K-Pressure transducer; L-
Pressure and temperatures displays; M-Immersion
temperature controller; N-Polystyrene chips;
O-Transparent acrylic bath.
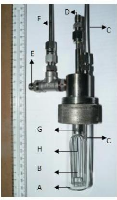
Photograph 4.3: The dilutor cell. A-Glass
still; B-Capillaries; C-Temperature probe (Pt 100);
D-Gas inlet; E-Gas
outlet; F-Pressure transducer tube; G-Bolt (seal); H-Teflon plug (seal).
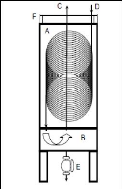
Figure 4-2: Cross Section of the cold trap to
illustrate its inner workings (George 2008)
A - Upper chamber, B - lower
chamber, C - gas inlet, D - non-condensable gas outlet, E -
release valve, F
- lid.
4.2.2.5. Gas Chromatography apparatus
In this work, a SHIMADZU GC 14A gas chromatograph equipped
with a FID detector was used. The FID has the advantage over the TCD to be very
sensitive to small amounts of solutes injected. GC settings and column
conditions during experiments are displayed in table 4-1. To avoid condensation
of the solute as the stream flows from the dilutor cell outlet to the GC
injection port via the six-port sampling valve, these lines had to be heated
and thermostated at a temperature approximately 40 oC higher than
the system temperature (Krummen et al. 2000).
Table 4-1: GC specification and set-up.
Column CRS; 2m x 1/8`; Packed column
GC Program Clarity work station
Detector type FID
Carrier gas Helium
Injection Port Temperature 493.15 K
Column Oven Temperature 393.15 K-453.15 K
Detector Temperature 493.15 K
4.2.3. Experimental procedure
First, the cells were cleaned and thereafter filled with the
required components. The solvent was poured into each cell. The mass of the
solvent in the dilutor cell had to be known accurately. The solute was injected
into the dilutor cell in very small concentration to comply with the infinite
dilution requirement, less than 0.001 mole fraction. The injected volume ranged
between (10 and 25). Density data of the solvent (given in appendix C) were
used to
determine by difference the vapour phase volume. The cells
were then sealed and fitted onto the set up. The equipment was checked for
leaks, the cold trap upper chamber was filled with acetone-ice mixture, the GC
apparatus and all electrical equipments with desired settings were switched on.
Thereafter the procedure below was followed:
1. The water bath, the sampling valve, the mixture in the
dilutor cell and all other tubing were allowed to equilibrate to their
respective set-point temperatures, the magnetic stirrer being switched on;
2. The inert gas was allowed to flow through the cell. A
bubble soap flow-meter was used to measure the flow rate. Li et al. (1993)
suggested that the infinite dilution activity coefficient obtained should be
independent of the flow rate;
3. The gas sampling valve was set to the fill? position,
allowing the inert gas to flow for some minutes;
4. The gas sampling valve was set to the inject? position for
one to two minutes;
5. The sampling valve was set back to the fill? position;
6. Steps 4 and 5 were repeated periodically. The time
interval between two successive injections depended on the system under
investigation. The natural logarithm of the solute peak area was expected to
decrease linearly with time as illustrated by figure 4-3 which was taken from a
publication by Krummen et al. (2000);
7. After a number of runs with sufficient data to compute
infinite dilution activity coefficient values, the experiment was ended.
Equation (3-90) was used to determine experimental IDAC values.
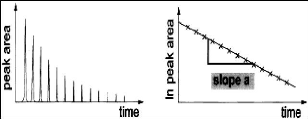
Figure 4-3: Typical plots of solute GC peak area
and ln (solute peak area) versus time.
| 

