4.4 Watershed characteristics
Watershed characteristics are subdivided in 2 major groups:
physiographical and hydrological. The physiographical characteristics of a
watershed influence to a large degree its hydrological responses and especially
the flow regime during floods and periods of drought, hence the discharge, and
the concentration time, which characterizes the speed and intensity of the
watershed's reaction to stress (rainfall), is influenced by the different
morphological characteristics. The analysis of the hydrologic behavior of a
watershed is done in order to study the hydrologic reaction of the watershed in
relation to rainfall. The Horton morphometric parameters will be described
separately.
4.4.1 Watershed Geomorphology 4.4.1.1 Area and
length
The drainage area (A) is probably the single most important
watershed characteristic for hydrologic design and reflects the volume of water
that can be generated from rainfall. It is common in hydrologic design to
assume a constant depth of rainfall occurring uniformly over the watershed.
Under this assumption, the volume of water available for runoff would be the
product of rainfall depth and the drainage area. Thus the drainage area is
required as input to models ranging from simple linear prediction equations to
complex computer models (McCuen, 2005).
The computed watershed area is of 3778879 km2, which
is strongly closer to 3,780,000km2, value estimated by Asante (2000)
using ArcMap.
Table 6 Sub-wateshed characteristics of the
CRB
|
|
|
|
|
|
|
|
|
|
|
|
1
|
Ouesso
|
2364.2
|
155408
|
3572.4
|
22.73
|
792.9
|
730197.6
|
341
|
762
|
702
|
|
2
|
Sangha South
|
2186.6
|
130671
|
3117.0
|
23.59
|
697.8
|
625778.7
|
234
|
457
|
343
|
|
3
|
Ubangi
|
6845.5
|
639564
|
15455.1
|
23.9
|
2538.5
|
2472266
|
291
|
1272
|
1133
|
|
4
|
Kasai
|
5516.5
|
895179
|
25007.0
|
27.62
|
2102.4
|
2022944
|
234
|
1481
|
1282
|
|
5
|
Lualaba
|
7264.1
|
1109014
|
27362.9
|
24.4
|
3083.4
|
3020203
|
429
|
1842
|
1446
|
|
6
|
Congo
|
11000.0
|
849063
|
19436.5
|
22.64
|
3515.9
|
3470018
|
0
|
1128
|
1032
|
|
CRB
|
13475054
|
3778879
|
93953.5
|
24.6
|
5112.7
|
5049.5
|
0
|
1842
|
1446
|
Table 7 Extracted sub-watersheds areas of the
CRB
|
ID
|
Names
|
Area (km square)
|
|
Calculated
|
Repported
|
Source
|
|
1
|
Ouesso
|
155408
|
180418
|
|
|
2
|
Sangha South
|
130671
|
|
3
|
Ubangi
|
639564
|
613202
|
|
|
4
|
Kasai
|
895179
|
925172
|
|
|
5
|
Lualaba
|
1109014
|
|
|
|
6
|
Congo
|
849063
|
|
|
|
Min
|
130671
|
|
|
|
Avg
|
629817
|
|
|
|
Sum
|
3778879
|
3755441
|
Asante (2000)
|
For a better and easier use of the DEM in the Congo River
hydrological model, the Congo Basin was subdivided in 6 major sub-watersheds,
namely: LUALABA, OUESSO, UBANGI, CONGO, SANGHA SOUTH and KASAI (Figure 22). The
Congo sub-watershed is a shapeless basin since it is a residue after the
selection of the other 5 major sub-watersheds; therefore it will not be
considered in the water balance process.
4.4.1.2 Watershed Shape
The shape of a watershed influences the shape of its
characteristic hydrograph. For example, a long shape watershed generates, for
the same rainfall, a lower outlet flow, as the concentration time is higher.
A watershed having a fan-shape presents a lower concentration
time, and it generates higher flow.
Different geomorphologic indices can be used for the analysis
of a watershed if its shape is taken into consideration. The most frequently
used index is the Gravelius's index KG, which is defined as the
relation between the perimeter of the watershed and that of a circle having a
surface equal to that of a watershed.
(20)
P P
K =
G
0.28
2 · A A
Where KG is the Gravelius's shape index, A is the watershed area
[km2] and P, watershed perimeter [km].
Musy (2001) presented different values of the Gravelius's
index whose comparison to the Congo Basin (Gravelius index = 1.93) makes it to
be treated like a circular basin. However, the Gravelius Index varies from one
sub-watershed to an other one.
4.4.2 Morphometric Analysis
The morphometric network is defined as the sum of all the
watercourses, natural or artificial, permanent or temporary, which contribute
to the runoff. The characteristics of a hydrographic network of a watershed are
influenced by four main factors: geology, climate, relief and environment.
4.4.2.1 Morphometric network
topology
The classification of the watercourses was introduced by
Strahler (1957). The order of the watercourses reflects the degree of
ramification of the morphometric network from upstream to downstream and it is
based on the following principles: (Musy, 2001)
all watercourses without tributaries are of 1 st order;
the watercourse formed by the confluence of two watercourses of
different order is going to keep the highest order of the two;
the watercourse formed by the confluence of two watercourses of
same order is going to have an order higher with one than the other two.
Seven Sthraler orders and 898 Shreve orders were identified in
the Congo basin (Appendix 6).
4.4.2.2 Horton morphometric
parameters
Based on the Horton's infiltration equation fame, Horton Laws and
ratio were developed in order to describe the geomorphological characteristics
of watershed based on the stream properties.
This ratio can be calculated manually if considering a simple
illustrative model. Considering the sub-continental size of the Congo Basin,
the estimation of Horton morphometric parameter were calculated using the
DEM-Hydrological module of ILWIS version 3.4, if not it would not be possible.
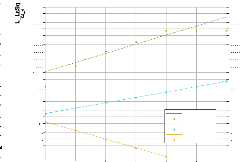
Figure 24 shows different graphs for the derived Horton morphometric parameters
for the Congo Basin and the following section define each of them and present
the results.
4.4.2.2.1 Streams number and bifurcation ratio
(RB)
STREAM NUMBER (or stream order) is a
measure of the degree of stream branching within a watershed. Each length of
stream is indicated by its order. The principal order in the Congo Basin is 7
and can be find only in the Congo subwatershed. The stream number for each
Subwatershed is given in Table 8.
The concept of stream order is used to computer other indicators
of drainage characteristics presented in the following paragraph.
Table 8 Stream numbers and Bifurcation Ratio for
sub-watersheds of the Congo River
|
Stream Order
|
Ouesso
|
Sangha
|
Ubangi
|
Kasai
|
Lualaba
|
|
1
|
30
|
26
|
118
|
168
|
261
|
|
2
|
6
|
8
|
32
|
42
|
54
|
|
3
|
3
|
1
|
9
|
13
|
14
|
|
4
|
1
|
1
|
2
|
5
|
3
|
|
5
|
0
|
0
|
1
|
2
|
1
|
|
6
|
0
|
0
|
0
|
1
|
|
BIFURCATION RATIO (RB) is defined as
the ratio of the number of streams of any order to the number of streams of the
next highest order. It is calculated as
Where Ni: number of streams of order I.
For the selected subwatershed, values of Rb range between 2.7
and 5.1 (Table 9); which falls into the theoretical interval [2 to 6] and a
typical interval (3 to 5) is reported in the literature (MacCuen, 2005).


CONGO RIVER BASIN SANGHA CATCHMENT
1000000
1000000
500000
500000
|
|
|
|
|
|
|
|
|
|
|
|
|
|
|
|
|
|
|
|
|
|
|
|
|
|
|
|
|
|
|
|
|
|
|
|
|
|
|
|
|
|
|
|
|
|
|
|
|
|
|
|
|
|
|
|
|
|
|
|
|
|
|
|
|
|
|
|
|
|
|
|
|
|
Order x C1A LSq Order x C1A Order x C1LLSq Order x C1L
Order x C1NLSq
Order x C1N
|
|
|
|
|
|
|
|
|
|
|
|
|
|
|
|
|
|
|
|
|
|
|
|
|
|
|
|
|
|
|
|
|
|
|
|
|
|
|
|
|
|
|
|
|
|
|
|
|
|
|
|
|
|
|
|
|
|
|
|
|
|
|
|
|
|
|
|
|
|
|
|
|
|
|
|
|
|
|
|
|
|
|
|
|
|
|
|
|
|
|
|
|
|
|
Order x C1ALSq
|
|
|
|
|
Order x C1LLSq
Order x C1NLSq
|
|
|
|
Order x C1A
Order x C1L
|
|
|
|
|
Order x C1N
|
|
|
|
|
|
|
|
|
|
|
|


500000
500000
200000
200000
200000
200000
100000
100000
100000
100000
50000
50000
50000
50000
20000
20000
20000
20000
10000
10000
10000
10000
5000
5000
5000
5000
2000
2000
2000
2000
1000
1000
1000
1000
500
500
500
500
200
200
200
200
100
100
100
100
50
50
50
50
20
20

20
20

10
10
10
10
5
5

5
5
2
2
2
2
1
1
1
1
1 2 3 4 5 6 7
1 2 3 4 5 6 7 1 2 3 4 5 6 7
1 2 3 4 5 6 7
Order
Order
Order Order
Kasai
Ubangi
Kasai Ubangi
1000000
1000000
100000
100000
|
|
|
|
|
|
|
|
|
|
|
|
|
|
|
|
|
|
|
|
|
|
|
|
|
|
|
|
|
|
|
|
|
|
|
|
|
|
|
|
|
|
|
|
|
|
|
|
|
|
|
|
|
|
|
|
|
|
|
|
|
Order x C3ALSq Order x C3A
Order x C3NLSq Order x C3N
Order x C3LLSq Order x C3L
|
|
|
|
|
|
|
|
|
|
|
|
|
|
|
|
|
|
|
|
|
|
|
|
|
|
|
|
|
|
|
|
|
|
|
|
|
|
|
|
|
|
|
|
|
|
|
|
|
|
|
|
|
|
|
|
|
|
|
|
|
|
|
|
|
|
|
|
|
|
|
|
|
|
|
|
|
|
|
|
|
|
|
|
Order x C4ALSq Order x C4A Order x C4LLSq Order x C4L
Order x C4NLSq Order x C4N
|
|
|
|
|
|
|
|
|
|
|
|
|
|
|
|
|
|
|
|
|
|
|
|
|
|
|
|
|
|
|
|
|


500000
500000
50000
50000
200000
200000
20000
20000
100000
100000
10000
10000
50000
50000
5000
5000
20000
20000
10000
10000
2000
2000
5000
5000
1000
1000
2000
2000
500
500
1000
1000
200
200
500
500
100
100
200
200
50
50
100
100
50
50
20
20
20
20
10
10
10
10
5
5
5
5
2
2
2
2
1
1
1
1
1 2 3 4 5 6 7
1 2 3 4 5 6 7 1 2 3 4 5 6 7
1 2 3 4 5 6 7
Order
Order
Order Order
Lualaba
CONGO SUBWATERSHED
100000
100000
|
|
|
|
|
|
|
|
|
|
|
|
|
|
|
|
|
|
|
|
|
|
|
|
|
|
|
|
|
|
|
|
|
|
|
|
|
|
|
|
|
|
|
|
|
|
|
|
|
|
|
Order x C5ALSq Order x C5A Order x C5LLSq Order x C5L
Order x C5NLSq Order x C5N
|
|
|
|
|
|
|
|
|
|
|
|
|
|
|
|
|
|
|
|
|
|
|
|
|
|
|
|
|

10000000
10000000
50000
50000
5000000
5000000
2000000
2000000
20000
20000
1000000
1000000
10000
10000
500000
500000
5000
5000
200000
200000
100000
100000
2000
2000
50000
50000
1000
1000
20000
20000
10000
10000
500
500
5000
5000
200
200
2000
2000
1000
1000
100
100
500
500
50
50
200
200
Order x C5ALSq Order x C5A Order x C5LLSq Order x C5LLSq Order
x C5NLSq Order x C5NLSq
20
20
100
100
50
50
10
10
20
20
5
5
10
10
5
5
2
2
2
1
1
1
1
1 2 3 4 5 6 7
Order
1 2 3 4 5 6 7
Order
Figure 25 Horton morphometric parameters for 4 selected
sub-watersheds in the Congo River
37
Table 9 Horton Morphometric Parameters for the
sub-catchments in the Congo River.
|
Sub- watersheds
|
RB
|
RL
|
RA
|
|
Ouesso
|
3.2
|
2.4
|
3.5
|
|
Sangha South
|
5.1
|
1.7
|
6.1
|
|
Ubangi
|
4.0
|
2.2
|
4.3
|
|
Kasai
|
2.7
|
1.6
|
3.3
|
|
Lualaba
|
4.2
|
2.3
|
4.6
|
|
MIN
|
2.7
|
1.6
|
3.1
|
|
MAX
|
5.1
|
2.5
|
6.1
|
4.4.2.2.2 Law of Stream Lengths and stream length
ratio (RL)
The stream length assumes that the average lengths of the streams
of successive orders are related by a length ratio RL, and given by the
equation:
(22)
L
R thus L L R
= = ×
i
L L +
1
i i L
1
i +
Table 10 Stream Length Ration for the different
sub-catchments in the Congo River
|
Ouesso
|
Sangha
|
Ubangi
|
Kasai
|
Lualaba
|
|
C1_L
|
C2_L
|
C3_L
|
C4_L
|
C5_L
|
|
Stream Order
|
1
|
64.74
|
64.76
|
65.19
|
77.44
|
57.51
|
|
2
|
196.02
|
183.8
|
191.43
|
234.59
|
185.49
|
|
3
|
384.32
|
189.49
|
340.46
|
476.94
|
346.48
|
|
4
|
662.01
|
664.74
|
932.09
|
82 1.84
|
98 1.2
|
|
5
|
0
|
|
2130.4
|
1013.09
|
2265.76
|
|
6
|
0
|
0
|
0
|
1152.81
|
0
|
|
7
|
0
|
0
|
0
|
0
|
0
|
|
Horton Ratio
|
RL
|
2.44
|
1.71
|
2.21
|
1.64
|
2.3
|
The stream length ratio values (Table 10) fall between the
natural limits ranges of 1.6 - 2.5 (MacCuen, 2005).
1 2 3 4 5 6 7
Strahler x StraightLength
300000
250000
200000
150000
100000
50000
0
Strahler
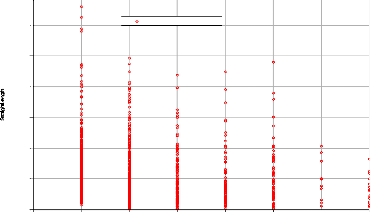
Figure 26 Strahler order vs. Stream length
map
Above (Figure 26) is a plot of Strahler stream order and
stream length. It is evident form the figure that this region has well defined
geomorphic features with stream length of 1 st order streams varying from 3 km
to 335 km, and 7th order streams with length varying from 0 to 90 km. Also, the
stream number in a subwatershed is inversely correlated to the stream order
(FigurF26).
4.4.2.2.3 Stream Area Ratio (RA)
Stream ratio is given by the following equation and the obtained
values from the DEMHydro processing are presented in Table 11 bellow.
RA
A i + 1
= (23)
Ai
Table 11 Stream Ration for the selected
subwatershed
|
Ouesso
|
Sangha
|
Ubangi
|
Kasai
|
Lualaba
|
|
C1_A
|
C2_A
|
C3_A
|
C4_A
|
C5_A
|
|
Stream Order
|
1
|
3322.57
|
C2_A
|
3137.12
|
2986.6
|
2591.04
|
|
2
|
21035.86
|
3258.19
|
15777.09
|
16796.23
|
16541.88
|
|
3
|
49761.68
|
14855.7
|
61493.83
|
63232.86
|
70292.39
|
|
4
|
158672.2
|
119366.6
|
296725.4
|
177175
|
358082.7
|
|
5
|
0
|
132257.5
|
646792.4
|
450879.8
|
1121600
|
|
6
|
0
|
0
|
0
|
905331.4
|
0
|
|
7
|
0
|
0
|
0
|
0
|
2445.2
|
|
Horton Ratio
|
RA
|
3.5
|
6.05
|
4.34
|
3.25
|
4.6
|
4.4.2.2.4 Channel slopes and length
The steep slope of a watercourse favours and accelerates the
runoff, while a small slope gives the water the necessary time to infiltrate
totally or partially into the soil. The calculation of the average slope is
obtained from the longitudinal profile of the main stream and its
tributaries.
The most frequent method used to calculate the longitudinal
slope of a watercourse consists of correlating the difference of altitude of
the extreme points of the stream with its length.
where: S1 longitudinal slope of stream [m/km] or
[%o]
?H: difference of altitude of the extreme points of
the stream [m]
L: total length of the stream between its extreme
points [km]
At a spatial resolution of 1 km (Hydrosheds and Hydro1k) the
slope values for each pixel grid seems to be negligible.
4.4.2.2.5 Channel degree of
development
Drainage density, introduced by Horton, is the ratio of the total
length of streams within a watershed to the total watershed area (Equation
24).
where: Dd: degree of development of the hydrographic network
[km/km2], Li: length of the stream [m] and A: watershed surface [km].
The Density values for each subwatershed are given in Table
12. The subwatershed density varies between 22.6 and 27.6 with a mean of 24.2
and a standard error of 0.63. A high value of stream density indicates a
relatively high density of streams and thus a rapid storm response. The
development of stream seems to be uniform all over the basin.
Table 12 Drainage density for watersheds of the Congo
River
|
ID
|
1
|
2
|
3
|
4
|
5
|
6
|
|
|
Name
|
Ouesso
|
Sangha South
|
Ubangi
|
Kasai
|
Lualaba
|
Congo
|
CRB
|
|
A (Km2)
|
155408
|
130671
|
639564
|
895179
|
1109014
|
849063
|
3778879
|
|
Li (m)
|
3572.4
|
3117
|
15455.1
|
25007
|
27362.9
|
19436.5
|
93953.5
|
|
Dd (m/Km2)
|
22.73
|
23.59
|
23.9
|
27.62
|
24.4
|
22.64
|
24.6
|
Owing to the fact that all the Horton geomophometric
parameters fall in the accepted natural limits, we assume that the 5
sub-watershed extracted from the DEM are representative for the Congo watershed
and can therefore be used in the GIS-linked hydrological model to develop.
| 

