2.3 Hydrology
The Congo has a regular flow, which is fed by rains throughout
the year. As recorded at Kinshasa, the flow has for years remained between the
high level of 65411.92 m3/s, recorded during the flood of 1908, and
the low level of 21407.54 m3/s, recorded in 1905. During the unusual
flood of 1962, however, by far the highest for a century, the flow probably
exceeded 73623.8 m3/s (Encyclopedia Britannica, 2007). At Kinshasa,
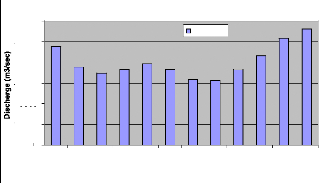
the river's regime is characterized by a main maximum at the end of the year
and a secondary maximum in May, as well as by a major low level during July and
a secondary low level during March and April (Figure 4, Table 1). In reality,
the downstream regime of the Congo represents climatic influence extending over
20° of latitude on both sides of the equator, a distance of some
2253km.
The Congo River's flow and water levels are affected by the
rains all year round. It is the effects of rainfall throughout the regions
whose rivers and tributaries contribute to the Congo River that influence the
fluctuations in the flow of the river. However, because the Congo basin has an
immense area, the weather pattern in one particular region will not have much
effect on the river's overall levels. For example, heavy rainfall in the
northern areas that contribute to the
Table 1 River discharge at KINSHASA gauge (after
Vorosmarty et al, 1998) Station: Kinshasa, Latitude: 4.3o S/
Longitude: 15.3o E, Elevation: River: Zaire,
Country: Congo D.R., Area:
3475000 km2
|
-
|
Jan
|
Feb
|
Mar
|
Apr
|
May
|
Jun
|
Jul
|
Aug
|
Sep
|
Oct
|
Nov
|
Dec
|
Ann
|
|
m 3 /s
|
47494
|
37649
|
34713
|
37172
|
39150
|
36717
|
31703
|
31087
|
36366
|
43172
|
51708
|
56082
|
40251
|
|
mm
|
36.6
|
26.4
|
26.8
|
27.7
|
30.2
|
27.4
|
24.4
|
24
|
27.1
|
33.3
|
38.6
|
43.2
|
366
|
|
km 3
|
127
|
91.9
|
93
|
96.3
|
105
|
95.2
|
84.9
|
83.3
|
94.3
|
116
|
134
|
150
|
1270
|
|
l/s/km 2
|
13.7
|
10.8
|
9.99
|
10.7
|
11.3
|
10.6
|
9.12
|
8.95
|
10.5
|
12.4
|
14.9
|
16.1
|
11.6
|
|
%
|
9.83
|
7.79
|
7.19
|
7.7
|
8.11
|
7.6
|
6.56
|
6.44
|
7.53
|
8.94
|
10.7
|
11.6
|
100
|
40000
60000
20000
50000
30000
10000
0
Jan Feb Mar Apr May Jun Jul Aug Sep Oct Nov Dec
Month
Mean Discharge Regime (1903-1983)
Discharge
Figure 3 Mean Discharge Regime of the Congo River Basin
at the Kinshasa gauge
40000
20000
80000
60000
Jan-00 Jan-10 Jan-20 Jan-30 Jan-40 Jan-50 Jan-60 Jan-70 Jan-80
Time
Monthly Discharge at Kinshasa gauge (Mean 1903-1
983)
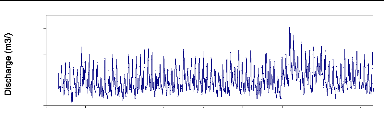
Figure 4 Monthly discharge of the Congo River (Kinshasa
gauge). Mean 1960-1990
Patterns have been established in the past and the river can be
expected to have higher levels
in December and May due to the rainy season.
The levels are expected to be low in March and
April and even lower in July in response to the dry season. If
some of the weather patterns change drastically, resulting in floodwaters
arriving at the same or different times, then the anticipated water levels are
affected accordingly.
2.4 Climate
The Congo basin is located in the equatorial belt. This
location ensures that different parts of the Congo basin receive substantial
rainfall throughout the year; with a decreasing trend of rainfall with
latitude. The northern and central portions of the basin have two major
rainfall seasons which begin in March and October each year (Kazadi, 1996). The
northernmost points of the basin, situated in the Central African Republic,
receive 8 to 406.4 mm during the course of a year, which is less than the
average near the equator; the dry season, however, lasts for four or five
months, and there is only one annual rainfall maximum, which occurs in
summer.
In the south, the two rainfall seasons gradually merge into a
single season beginning in December and lasting for six months each year. In
the far southern part of the basin -- at a latitude of 12° S, in the
Katanga region -- the climate becomes definitely Sudanic in character, with
marked dry and wet seasons of approximately equal length and with mean rainfall
of about 1245 mm a year.
The rainfall peaks are associated with the passage of the
Inter-Tropical Convergence Zone (ITCZ), which is a large zone of low pressure
caused by excessive heating from an overhead sun. During the northern summer,
the midday sun is directly overhead in the tropical regions of the Northern
Hemisphere. This results in higher temperatures and consequently, lower air
pressures at the surface. Moist air flows from the oceans towards these low
pressure areas. The moisture is released as rainfall on the land surface when
the air is forced to rise on entering the convergence zone or by orographic
effects. The ITCZ causes heavy rainfall in the areas it passes over as it moves
north and south between the tropics during the respect northern and southern
summers. The Congo basin is thus representative of a large river basin in which
the spatial distribution of input varies significantly with time.
Figures 6 bellow shows the monthly distribution of rainfall,
Evapotranspiration and temperature for 8 stations over the Conog Basin. Figure
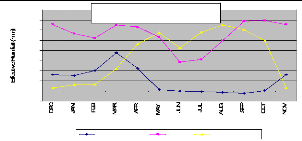
7 and Table 2 give the evective rainfall for three virtual stations located in
the southern hemisphere, northern and the center of the basin.
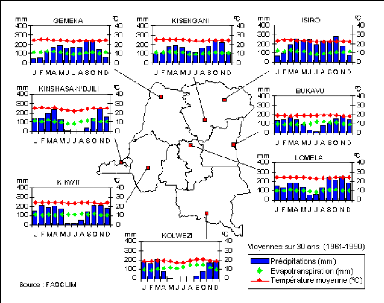
Figure 5 Meteorological profile of
D.R.Congo
Table 2 Effective Rainfall distribution in the Congo Basin
|
Long
|
Lat
|
Dec
|
Jan
|
Feb
|
Mar
|
Apr
|
May
|
Jun
|
Jul
|
Aug
|
Sep
|
Oct
|
Nov
|
|
12
|
-14
|
32
|
30.1
|
40.4
|
75.6
|
44.6
|
1.8
|
-0.5
|
-1.2
|
-2.8
|
-5.1
|
0.7
|
32
|
|
23.58
|
-2
|
131.3
|
113.6
|
104.2
|
129.9
|
126.3
|
106
|
57.1
|
61.7
|
99.4
|
137.6
|
139.2
|
131.3
|
|
35
|
10
|
5.8
|
11.9
|
12.7
|
43.5
|
92.7
|
114.8
|
84.7
|
115.5
|
129.8
|
121.1
|
98.7
|
5.8
|
160
140
120
100
-20
40
80
60
20
0
Lowest station Center Upper Station
Grid: Long. 23.58, Lat. -2.00
Months
Figure 6 Long-term monthly average of Effective
Rainfall (1961-1990) at grid cell.
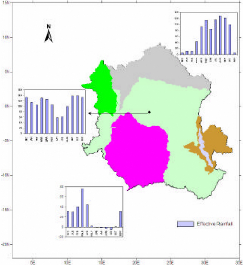
Figure 7 Effective rainfall distribution for three
selected grids in the Area
| 

