CHAPTER FOUR: DATA
PRESENTATION, ANALYSIS, AND INTERPRETATION
This chapter presents results drawn from collected data. The
target population was the members of ABAHUZAMUGAMBI Cooperative, whose main
activity is to grow coffee known as MARABA Coffee.
Maraba coffee is grown in the MARABA area in southern province
of Rwanda MARABA's coffee plants are the Bourdon variety of the coffee Arabica
Species and are grown on fertile volcanic soil or on high altitude hills. The
fruit is handpicked mostly during the rain season between March and May and
brought to a washing station in MARABA, where the coffee beans are extracted
and dried. At several stages, the beans are stored according to quality.
Farmers receive credit based on the quantity of beans they provide.
In 1999 ABAHUZAMUGAMBI Cooperative was created with about 200
members. From since the Cooperative has been supported by the National
University of Rwanda and SPREAD, and working hand by hand the Cooperative has
improved the Coffee quality and penetrated on international market.
4.1. Level of Empowerment and Status of Development
The level of empowerment is going to be discussed according to
the SPREAD-NUR's components based on empowerment indicators using collected
data. This is to measure the perception of people toward SPREAD-NUR's
contributions. Also the comparison between pre-SPREAD-NUR and post-SPREAD-NUR
existence will be discussed as well in order to reflect the people's perception
on the SPREAD-NUR and their community.
4.2. Demographic
Characteristics of the Respondents
4.2.1. Distribution by Age and
Sex
Figure 2. Sex
distribution
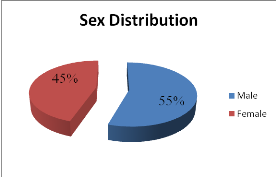
This figure 2 shows the distribution of the 66 samples by sex,
and shows that 55% of total respondents were Males and 45% were Females. To
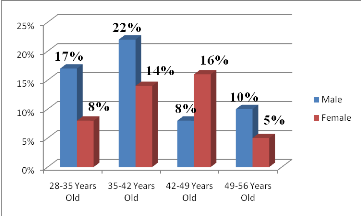
analyze age and sex all respondents were into 4 age groups. The largest group
is 35-42 years old ranking 23 with 36% of the total respondents, this means
that the majority of samples is more than 35 years old and is likely to be
heads of families. 25% of respondents are under 35 years old and the oldest age
of all respondents is 54 years old.
Table 1. Age Group by Sex
|
Age Group * Sex Cross tabulation
|
|
Distribution of Respondents by Age and Sex
|
|
|
Male
|
Female
|
Total
|
|
28-35 Years Old
|
11
|
5
|
16
|
|
35-42 Years Old
|
14
|
9
|
23
|
|
42-49 Years Old
|
5
|
10
|
15
|
|
49-56 Years Old
|
6
|
3
|
9
|
|
|
36
|
27
|
63
|
Source:
Primary Data
Figure 3.Distribution of
respondents by Age and sex
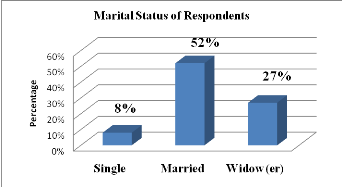
4.2.2. Distribution by marital
status
The below figure shows that the majority of the respondents
are married . They account for about 52% of the total sample. About 41% are
widows and the rest are single (8%).
In brief the main demographical profile of respondents is
married and mature more than 35 years old.
Table 1. Marital
status
|
Marital Status
|
|
|
Frequency
|
Percent
|
|
Single
|
5
|
8
|
|
Married
|
34
|
52
|
|
Widow (er)
|
27
|
41
|
|
Total
|
66
|
100
|
Source:
Primary Data
Figure 4. Marital Status of
Respondents
| 

