4.2.3. Occupation and Education
Level characteristics of respondents Household size
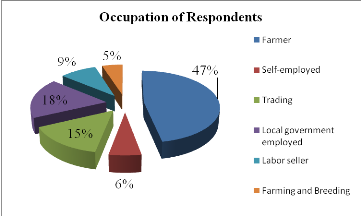
The following figure shows that the majority of respondents
are Farmers with 47% of the total sample; 6% represents self-employed
respondents, 15% represents traders, 18% represents Local government employed,
9% represents Labor seller, while 5% represents Breeding. The main factor that
they are concentrated in farms is because the total sample was composed of the
member of ABAHUZAMUGAMBI Cooperative and that the main activity of this
cooperative is oriented in coffee plantation.
Table 2. Occupation by
Respondents
|
Occupation of Respondents
|
|
Frequency
|
Percent
|
|
Farmer
|
31
|
47
|
|
Self-employed
|
4
|
6
|
|
Trading
|
10
|
15
|
|
Local government employed
|
12
|
18
|
|
Labor seller
|
6
|
9
|
|
Farming and Breeding
|
3
|
5
|
|
Total
|
66
|
100
|
Source: Primary
Data
Figure 5. Occupation of
Respondents
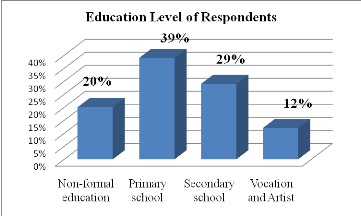
Respondent's education level shows that the majority of them
are concentrated in those who have completed primary 39%, those who have
completed Secondary school are represented by 29% of all respondents, those
who have Non-formal education are represented by 20% of all respondents, and
those who have Vocation and Artist level are represented by 12% of all
respondents.
Figure 6.
Education level of respondents
The below table shows that the household size s' pattern of
respondents is more represented by the household within 4-5 persons that is why
the on average each household counts 5 persons.
Table 3. Household
size
|
Household size
|
|
Minimum
|
Maximum
|
Mean
|
|
2
|
9
|
5.3
|
Source: Primary data
| 

