4.4. Perception toward
Income generating which increases earnings
Table 8. Bank Account
|
Frequency
|
Percent
|
Valid Percent
|
Cumulative Percent
|
Yes
|
|
62
|
93.9
|
93.9
|
93.9
|
No
|
|
4
|
6.1
|
6.1
|
100.0
|
Total
|
|
66
|
100.0
|
100.0
|
|
|
Source: Primary
data
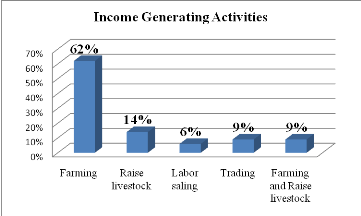
As illustrated in the above table , 94% of all respondents has
a bank account, and as illustrated in the below figure 62% of all respondents
is engaged in farming, 14% in raising animals ,6% in labor sale, 9% in Trading,
and 9% in Farming and Raise livestock as alternative activities to generate
income a part from coffee plantation. But the main income generating activity
is based on agriculture of coffee.
Due to the contribution of SPREAD-NUR in agriculture of
coffee, respondent are away of receiving enough income which allow them to put
aside a portion for saving and business.
Table 9.
Income Generating activities
|
Frequency
|
Percent
|
Cumulative Percent
|
Farming
|
|
41
|
62.1
|
62.1
|
Raise livestock
|
|
9
|
13.6
|
75.8
|
Labor sale
|
|
4
|
6.1
|
81.8
|
Trading
|
|
6
|
9.1
|
90.9
|
Farming and Raise livestock
|
|
6
|
9.1
|
100.0
|
Total
|
|
66
|
100.0
|
|
|
Source: primary data
Figure 12.
Income generating activities
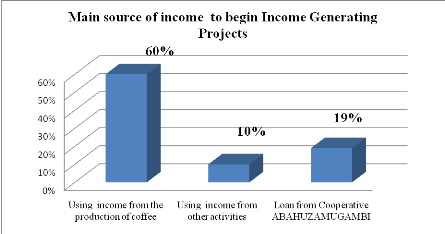
The below figure shows that 60% of total respondents agreed
that Income from coffee has an important contribution in starting the above
mentioned income generating activities or projects, 19% of total respondents
agreed that Loans from ABAHUZAMUGAMBI Cooperative have contributed in starting
the above income generating activities, while 10% agreed to use income from
other activities.
Figure 13. Main source of
income to start income generating projects
4.5. Perception toward Food
Security
Table 10. Food condition
|
Frequency
|
Percent
|
Cumulative Percent
|
Sufficient
|
|
36
|
60.0
|
60.0
|
Insufficient
|
|
24
|
40.0
|
100.0
|
|
Source: Primary data
Figure 14. Food condition
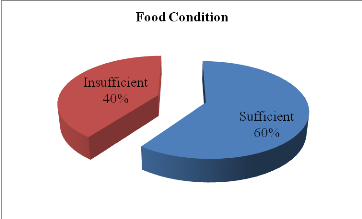
From the above table and figure, among the member of
ABAHUZAMUGAMBI surveyed, 60% of them rates food condition Sufficient, while 40%
of them see that food condition in their respective households is Insufficient.
This insufficient in food taken per day was supported by the number of meals
that they take per day, as the below figure demonstrates the majority of
respondents take meals Two times per day (67%), while the remaining part of
respondents reported that it takes meals Three time per day (33%), and among
respondents there is no case of persons who take meal once per day. Even though
the majority of respondent agrees that their meals in take have been increased
and ameliorated due to the intervention of SPREAD-NUR in the plantation of
coffee in their area.
Figure 15. Meals in take per day

Figure 16. Food
control
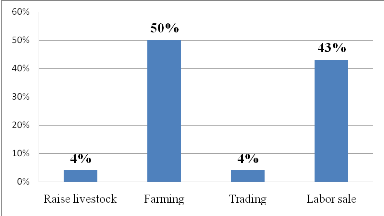
In order to control food quality and quantity in their
households when food is not enough, most of respondents reported that they take
orientation in farming (50%), 43% of them takes orientation in labor sale, 4%
Raises livestock, and 4% in trading.
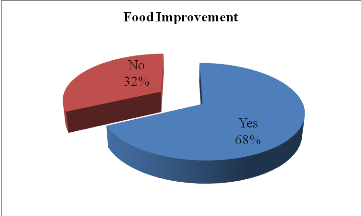
As the members of ABAHUZAMUGAMBI Cooperative are working with
SPREAD NUR they agree that there has been an improvement in food in take, this
means that the intervention of SPREAD-NUR in rural area is developing the way
of living of rural people. It is also understandable that with the improvement
of food many diseases from unbalanced food are eliminated, and therefore
population are away of concentrating on improving their social wellbeing toward
Development. 68% of total respondents reported that food served in their
household has been improved while only 32% disagreed this assertion, as shown
in the following table and figure.
Table
11. Improvement in food served
|
Frequency
|
Valid Percent
|
Cumulative Percent
|
Yes
|
|
41
|
68.3
|
68.3
|
No
|
|
19
|
31.7
|
100.0
|
Total
|
|
60
|
100.0
|
|
|
Source: Primary data
Figure
17. Food improvement
| 

