ANNEXES
Annexe 1 : Questionnaire de
l'enquête
Introduction:
This questionnaire is formulated for the purpose of a training
course for a Master degree at PID (Pan African Institute for Development), and
is entitled «Application of the contingent valuation method to measure the
demand and to plan school investments in under-scholarized areas: Case of
MBORORO populations of the North West region». Information collected will
be held confidential and will be used at exclusive ends of scientific and
academic research. Hence, the exactitude of your answers is an essential
element for the success of this work. Thank you for your patience and
contribution.
Name of the interviewer:
Date :
Sub-division :
A- INFORMATIONS ON THE PARENT
Sex: M
F
Age: _________ years
Profession: Grazer
Farmer Other (Indicate :______________)
Marital situation: Married
Divorced Widow
Matrimonial regime : Polygamous Monogamous
Religious confession of the household Muslims
Christians Animist
What is your level of education?
Primary school Secondary school
University Non- scholirized
A-1/ How many children do you have? :
___________
A-2/ Do you have a concern with the education of
your children(Y/N)? Yes NO
A-3/ Do you give importance to the quality of
this education(Y/N)? Yes NO
A-4/ How many school going age children do you
have? - Boys : ___
-Girls : ___
A-5/ How many children do you have who are
effectively going to school? - Boys : ___
-Girls :
___
B- INFORMATIONS ON THE EDUCATION BEHAVIOUR OF PARENTS
B-1/ Do you know the number of primary schools
in your locality(Y/N)? Yes NO
B-2/ Do you know the number of secondary general
schools in your locality(Y/N)? Yes NO
B-3/ Do you know the number of secondary
technical schools in your locality(Y/N)? Yes NO
B-4/ Do you know the number of Koranic schools
in your locality(Y/N)? Yes NO
II- 1 Primary education
B15/ How many children do you have in primary
school? - Boys : ___
-Girls : ___
B-16/ How far are these schools from your
house?
Nearer A bit
far Far
B-17/ By which means do your children go to
school?
On foot By car There are in the dormitory
Other (Indicate :___________)
B-18/ Do your children (those
who go to school) have basic school needs (text books, exercise books, pens
etc)?
All basic needs Some basic
needs None of the basic needs
B-19/ How many of your children have completed
their primary school? - Boys : ___
-Girls : ___
B-20/ If then umbers above are low, which
reasons can you evoke to justify this situation?
· For boys :
(a) You lack financial means.................................
(b) Are your children affected by
transhumance?...........
(c) The family loads are too
high............................
(d) It is not necessary for them to obtain the
FSLC.......
· For girls :
(a) You lack financial means
..................................
(b) The girl child education is not
important................
(c) Your daughters must go on
marriage....................
(d) The family loads are too high
...........................
(e) It is not necessary for them to obtain the
FSLC...... ..
B-21/ Are you member of the PTA of your
children's school (Y/N)? Yes NO
B-22/ How are the decisions taken during the
meetings? They are imposed By vote
B-23/ Do you think you can influence these
decisions, notably those concerning finances(Y/N)? Yes NO
II- 2 Secondary education
B-25/ How many children do you have in secondary
school? - Boys : ___
-Girls : ___
B-26/ How far are these schools from your
house?
Nearer A bit
far Far
B-27/ By which means do your
children go to school?
On foot By car There are in the dormitory
Other (Indicate :___________)
B-28/ Do your children (those who go to school)
have basic school needs (text books, exercise books, pens
etc)?
All basic needs Some basic
needs None of the basic needs
B-29/ How many of your children have completed
their secondary school? - Boys : ___
-Girls : ___
B-30/ If then umbers above are low, which
reasons can you evoke to justify this situation?
· For boys :
(a) You lack financial means.................................
(b) Are your children affected by
transhumance?...........
(c) The family loads are too
high............................
(d) It is not necessary for them to obtain the
A Level.......
· For girls :
(a) You lack financial means
..................................
(b) The girl child education is not
important................
(c) Your daughters must go on
marriage....................
(d) The family loads are too high
...........................
(e) It is not necessary for them to obtain the
A Level...... ..
B-31/ Are you member of the PTA of your
children's school (Y/N)? Yes NO
B-32/ How are the decisions taken during the
meetings? They are imposed By vote
B-33/ Do you think you can influence these
decisions, notably concerning the finances(Y/N)? Yes NO
C- VALORIZATION QUESTIONS
Primary education
C-11/ The expenses related to the education of a
child in the primary cycle (PTA+supplies+various) amount to 20,000 F CFA on
average per annum. Will you send your child to school for this amount?
Yes (Go to C-18)
NO (Go to C-12)
C-12/ Will you send your child to school if this
sum passes to 15,000 F CFA?
Yes (Go to C-18)
NO (Go to C-13)
C-13/ Will you send your child to school if this
sum passes to 10,000 F CFA?
Yes (Go to C-18)
NO (Go to C-14)
C-14/ Will you send your child to school if this
sum passes to 5,000 F CFA?
Yes (Go to C-18)
NO (Go to C-15)
C-15/ Will you send your child to school if this
sum passes to 2,000 F CFA?
Yes (Go to C-18)
NO (Go to C-16)
C-16/ Are you ready to pay something for the
education of your child?
Yes (Go to C-18)
NO (Go to C-17)
C- 17/ Do you thing that the responsibility for
the education of your children in the primary falls entirely on the state?
Yes
NO
C- 18/According to you, a good education in the
primary cycle is that which permits to a child:
(a) To know how to write and read
................................................
(b) To become autonomous with
respect to the others...........................
(c) To be prepared for a better
social insertion....................................
(d) To obtain his
FSLC.............................................................
C- 19/ Do you think that the schools (teachers,
administration, PTA) contribute to this success (Y/N)?
Yes
NO
C-20/ Are you satisfied by the quality of the
education offered to your children(Y/N)? Yes NO
C-21/ The government intends to build a primary
school in your locality; How much are you ready to spend annually for the
training of your child in that school?
20 000 F (or more) 15 000 F 10 000 F
5 000 F 2000 F 0 F
Secondary general education:
C-31/ The expenses related to the education of a
child in the secondary cycle general education (PTA+supplies+various) amount to
50,000 F CFA on average per annum. Will you send your child to school for this
amount?
Yes (Go to C-38)
NO (Go to C -32)
C-32/ Will you send your child to school if this
sum passes to 40,000 FCFA?
Yes (Go to C -38)
NO (Go to C -33)
C-33/ Will you send your child to school if this
sum passes to 30,000 FCFA?
Yes (Go to C -38)
NO (Go to C -34)
C-34/ Will you send your child to school if this
sum passes to 20,000 FCFA?
Yes (Go to C -38)
NO (Go to C -35)
C-35/ Will you send your child to school if this
sum passes to 10,000 FCFA?
Yes (Go to C -38)
NO (Go to C -36)
C-36/ Are you ready to pay something for the
education of your child?
Yes (Go to C -38)
NO (Go to C -37)
C-37/ Do you thing that the responsibility of
for the education of your children in the primary falls entirely on the state?
Yes
NO
C-38/According to you, a good education in the
secondary cycle is that which permits to a child
(a) To become an adult..............
................................................
(b) To become autonomous with
respect to the others...........................
(c) To be prepared for a better
social insertion....................................
(d) To obtain his A
Level.............................................................
C- 39/ Do you think that the schools (teachers,
administration, PTA) contribute to this success (Y/N)?
Yes
NO
C-40/ Are you satisfied by the quality of the
education offered to your children(Y/N)?
Yes
NO
C-41/ The government intends to build a
secondary general school in your locality; How much are you ready to spend
annually for the training of your child in that school?
50, 000 F (or more) 40,000 F 30, 000 F 20, 000
F 10, 000 F 0 F CFA
Secondary technical education:
C-51/ The expenses related to the education of a
child in the secondary cycle general education (PTA+supplies+various) amount to
75,000 F CFA on average per annum. Will you send your child to school for this
amount?
Yes (Go to C -58)
NO (Go to C -52)
C-52/ Will you send your child to school if this
sum passes to 50,000 FCFA?
Yes (Go to C -58)
NO (Go to C -53)
C-53/ Will you send your child to school if this
sum passes to 30,000 FCFA?
Yes (Go to C -58)
NO (Go to C -54)
C-54/ Will you send your child to school if this
sum passes to 20,000 FCFA?
Yes (Go to C -58)
NO (Go to C -55)
C-55/ Will you send your child to school if this
sum passes to 10,000 FCFA?
Yes (Go to C -58)
NO (Go to C -56)
C-56/ Are you ready to pay something for the
education of your child?
Yes (Go to C -58)
NO (Go to C -57)
C-57/ Do you thing that the responsibility of
for the education of your children in the primary falls entirely on the state?
Yes
NO
C-58/According to you, a good education in the
secondary cycle is that which permits to a child
(a) To become an adult..............
................................................
(b) To become autonomous with
respect to the others...........................
(c) To be prepare for a better
social insertion....................................
(d) To obtain his A
Level.............................................................
C- 59/ Do you think that the schools (teachers,
administration, PTA) contribute to this success (Y/N)?
Yes
NO
C-60/ Are you satisfied by the quality of the
education offered to your children(Y/N)?
Yes
NO
C-61/ The government intends to build a
technical school in your locality; How much are you ready to spend annually for
the training of your child in that school?
75,000 F (or more) 50,000 F 30,000 F 20,
000 F 10, 000 F 0 F
ANNEXE 2
Tableau 1 : offre en éducation dans la
région du nord-ouest
|
ORDRE D'ENSEIGNEMENT
|
Mezam
|
Menchum
|
Momo
|
Donga
mantumg
|
Bui
|
Ngoketundja
|
BOYO
|
TOTAL
|
|
ENSEIGNEMENT
PRIMAIRE
|
Etablissements publiques
|
173
|
125
|
154
|
253
|
168
|
106
|
36
|
1813
|
|
Etablissements privés laïques
|
163
|
25
|
04
|
16
|
33
|
12
|
06
|
|
Etablissements confessionnels
|
119
|
35
|
30
|
105
|
190
|
48
|
12
|
|
ENSEIGNEMENT
SECONDAIRE GENERAL
|
Etablissements publiques
|
37
|
19
|
33
|
47
|
47
|
22
|
24
|
331
|
|
Etablissements privés laïques
|
26
|
01
|
00
|
02
|
02
|
14
|
04
|
|
Etablissements confessionnels
|
12
|
03
|
05
|
14
|
14
|
04
|
01
|
|
ENSEIGNEMENT
SECONDAIRE TECHNIQUE
|
Etablissements publiques
|
19
|
07
|
14
|
13
|
13
|
08
|
09
|
113
|
|
Etablissements privés laïques
|
07
|
01
|
01
|
03
|
03
|
00
|
03
|
|
Etablissements confessionnels
|
02
|
00
|
00
|
04
|
04
|
00
|
02
|
|
Total
|
558
|
216
|
241
|
457
|
474
|
214
|
97
|
2257
|
Source :
Délégations régionales MINESEC et MINEDUB du
Nord-ouest
ANNEXE 3 : Fréquences des
CAP annoncés
Tableau 2: CAP annoncés pour l'enseignement
primaire
|
CAP PRIMARY
|
|
Frequency
|
Percent
|
Valid Percent
|
Cumulative Percent
|
|
Valid
|
0
|
1
|
,4
|
,4
|
,4
|
|
2000
|
83
|
31,1
|
33,6
|
34,0
|
|
5000
|
69
|
25,8
|
27,9
|
61,9
|
|
10000
|
52
|
19,5
|
21,1
|
83,0
|
|
15000
|
15
|
5,6
|
6,1
|
89,1
|
|
20000
|
27
|
10,1
|
10,9
|
100,0
|
|
Total
|
247
|
92,5
|
100,0
|
|
|
Missing
|
System
|
20
|
7,5
|
|
|
|
Total
|
267
|
100,0
|
|
|
Source : Auteur, à partir des
résultats de la base de données sur SPSS 20, 2012
Tableau 3: CAP annoncés pour l'enseignement
secondaire général.
|
CAP SECONDARY GENERAL
|
|
Frequency
|
Percent
|
Valid Percent
|
Cumulative Percent
|
|
Valid
|
0
|
1
|
,4
|
,5
|
,5
|
|
10000
|
86
|
32,2
|
39,6
|
40,1
|
|
20000
|
80
|
30,0
|
36,9
|
77,0
|
|
30000
|
30
|
11,2
|
13,8
|
90,8
|
|
40000
|
5
|
1,9
|
2,3
|
93,1
|
|
50000
|
15
|
5,6
|
6,9
|
100,0
|
|
Total
|
217
|
81,3
|
100,0
|
|
|
Missing
|
System
|
50
|
18,7
|
|
|
|
Total
|
267
|
100,0
|
|
|
Source : Auteur, à partir des
résultats de la base de données sur SPSS 20, 2012
Tableau 4: CAP annoncés pour l'enseignement
secondaire technique
|
CAP SECONDARY TECHNICAL
|
|
Frequency
|
Percent
|
Valid Percent
|
Cumulative Percent
|
|
Valid
|
0
|
1
|
,4
|
,6
|
,6
|
|
10000
|
67
|
25,1
|
37,2
|
37,8
|
|
20000
|
36
|
13,5
|
20,0
|
57,8
|
|
30000
|
55
|
20,6
|
30,6
|
88,3
|
|
50000
|
15
|
5,6
|
8,3
|
96,7
|
|
75000
|
6
|
2,2
|
3,3
|
100,0
|
|
Total
|
180
|
67,4
|
100,0
|
|
|
Missing
|
System
|
87
|
32,6
|
|
|
|
Total
|
267
|
100,0
|
|
|
Source : Auteur, à partir des
résultats de la base de données sur SPSS 20, 2012
ANNEXE 4 : la fréquence des
variables « importance de l'éducation » et
« valeur de l'éducation »
Tableau 5 : Valeur accordée à
l'éducation
|
Concern with children education
|
|
Frequency
|
Percent
|
Valid Percent
|
Cumulative Percent
|
|
Valid
|
yes
|
265
|
99,3
|
99,6
|
99,6
|
|
no
|
1
|
,4
|
,4
|
100,0
|
|
Total
|
266
|
99,6
|
100,0
|
|
|
Missing
|
System
|
1
|
,4
|
|
|
|
Total
|
267
|
100,0
|
|
|
Source : Auteur, à partir des
résultats de la base de données sur SPSS 20, 2012
Tableau 6 : Importance donnée à la
qualité de l'éducation
|
Importance of children education
|
|
Frequency
|
Percent
|
Valid Percent
|
Cumulative Percent
|
|
Valid
|
yes
|
261
|
97,8
|
98,1
|
98,1
|
|
no
|
5
|
1,9
|
1,9
|
100,0
|
|
Total
|
266
|
99,6
|
100,0
|
|
|
Missing
|
System
|
1
|
,4
|
|
|
|
Total
|
267
|
100,0
|
|
|
Source : Auteur, à partir des
résultats de la base de données sur SPSS 20, 2012
ANNEXE 5 : consentement a payer
moyen et médian
Tableau 7 : Moyenne et médiane du CAP par
rapport à la méthode des enchères.
|
Statistics
|
|
CAP PRIMARY
|
CAP SECONDARY GENERAL
|
CAP SECONDARY TECHNICAL
|
|
N
|
Valid
|
247
|
217
|
180
|
|
Missing
|
20
|
50
|
87
|
|
Mean
|
7271,26
|
19861,75
|
23555,56
|
|
Median
|
5000,00
|
20000,00
|
20000,00
|
|
Mode
|
2000
|
10000
|
10000
|
|
Std. Deviation
|
5834,028
|
11282,536
|
15313,200
|
|
Minimum
|
0
|
0
|
0
|
|
Maximum
|
20000
|
50000
|
75000
|
|
Sum
|
1796000
|
4310000
|
4240000
|
Source : Auteur, à partir des
résultats de la base de données sur SPSS 20, 2012
Tableau 8: Moyenne et médiane du CAP par
rapport à la méthode de la carte de paiement.
|
Statistics
|
|
Sum you are ready to pay /year for your child if the state
build a new prim school
|
sum you are ready to pay /year for your child if the state
build a sec.gen school
|
sum you are ready to pay /year for your child if the state
build a sec.tech school
|
|
N
|
Valid
|
255
|
228
|
191
|
|
Missing
|
12
|
39
|
76
|
|
Mean
|
6203,92
|
18070,18
|
19136,13
|
|
Median
|
5000,00
|
10000,00
|
10000,00
|
|
Minimum
|
0
|
0
|
0
|
|
Maximum
|
20000
|
50000
|
75000
|
Source : Auteur, à partir des
résultats de la base de données sur SPSS 20, 2012
ANNEXE 6: Analyse descriptive des
variables
Graphique 1 : Analyse descriptive de la
variable âge
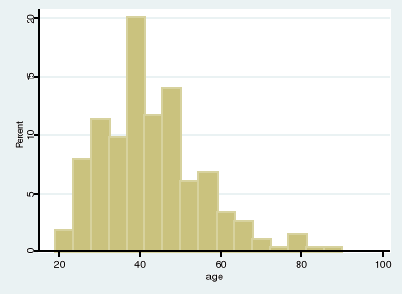
Source : Auteur, à partir des
résultats de la base de données sur SPSS 20, 2012
Tableau 9 : Analyse descriptive de la variable
Level of education
|
Level of education
|
|
Frequency
|
Percent
|
Valid Percent
|
Cumulative Percent
|
|
Valid
|
non scholarized
|
164
|
61,4
|
61,4
|
61,4
|
|
primary school
|
62
|
23,2
|
23,2
|
84,6
|
|
secondary school
|
34
|
12,7
|
12,7
|
97,4
|
|
University
|
7
|
2,6
|
2,6
|
100,0
|
|
Total
|
267
|
100,0
|
100,0
|
|
Source : Auteur, à partir des
résultats de la base de données sur SPSS 20, 2012
Tableau 10 : Analyse descriptive de la variable
profession
|
Profession
|
|
Frequency
|
Percent
|
Valid Percent
|
Cumulative Percent
|
|
Valid
|
Grazer
|
182
|
68,2
|
68,2
|
68,2
|
|
farmer/other
|
85
|
31,8
|
31,8
|
100,0
|
|
Total
|
267
|
100,0
|
100,0
|
|
Source : Auteur, à partir des
résultats de la base de données sur SPSS 20, 2012
Tableau 11 : Analyse descriptive des variables
Distance_prim
|
Distance_prim
|
|
Frequency
|
Percent
|
Valid Percent
|
Cumulative Percent
|
|
Valid
|
nearer
|
67
|
25,1
|
26,3
|
26,3
|
|
a bit far
|
80
|
30,0
|
31,4
|
57,6
|
|
far
|
108
|
40,4
|
42,4
|
100,0
|
|
Total
|
255
|
95,5
|
100,0
|
|
|
Missing
|
System
|
12
|
4,5
|
|
|
|
Total
|
267
|
100,0
|
|
|
Source : Auteur, à partir des
résultats de la base de données sur SPSS 20, 2012
Tableau 12 : Analyse descriptive des variables
Distance_sec
|
Distance_sec
|
|
Frequency
|
Percent
|
Valid Percent
|
Cumulative Percent
|
|
Valid
|
nearer
|
15
|
5,6
|
7,4
|
7,4
|
|
a bit far
|
64
|
24,0
|
31,5
|
38,9
|
|
far
|
124
|
46,4
|
61,1
|
100,0
|
|
Total
|
203
|
76,0
|
100,0
|
|
|
Missing
|
System
|
64
|
24,0
|
|
|
|
Total
|
267
|
100,0
|
|
|
Source : Auteur, à partir des
résultats de la base de données sur SPSS 20, 2012
Tableau 13 : Analyse descriptive de la variable
Number of chidren
|
Descriptive Statistics
|
|
N
|
Minimum
|
Maximum
|
Sum
|
Mean
|
Std. Deviation
|
|
Number of children
|
265
|
1
|
25
|
1999
|
7,54
|
4,596
|
|
Valid N (listwise)
|
265
|
|
|
|
|
|
Source : Auteur, à partir des
résultats de la base de données sur SPSS 20, 2012
ANNEXE 7 : Tableau
récapitulatif des variables.
|
VARIABLES
|
LIBELLE
|
CODIFICATION
|
EFFET ESCOMPTE
|
|
CAP_Prim
|
Consentement à payer cycle primaire
|
CAP_Prim
|
|
|
CAP_Sec_gen
|
Consentement à payer cycle secondaire
général
|
CAP_Sec_gen
|
|
|
CAP_sec_tech
|
Consentement à payer cycle secondaire technique
|
CAP_sec_tech
|
|
|
Age
|
Age du chef de ménage
|
|
négatif
|
|
Education
|
|
0=Non scholarized
1=Primary education
2=secondary education
3=University
|
positif
|
|
Number_of_children
|
Nombre d'enfants du chef de ménage
|
|
négatif
|
|
Profession
|
Profession exercée par le chef de ménage
|
1=Grazer
3=Other
|
négatif
|
|
Distance_prim
|
Distance de la maison à l'école, enseignement
primaire
|
1=Nearer
2=A bit far
3=Far
|
négatif
|
|
Distance_sec
|
Distance de la maison à l'école, enseignement
secondaire
|
1=Nearer
2=A bit far
3=Far
|
négatif
|
|
Mariage
|
Le mariage des jeunes filles comme justificatif de leur
non-scolarisation
|
1=Option cochée
0=Option non cochée
|
négatif
|
|
Lack_of_finance_prim
|
Le manque de moyens financiers comme justificatif de leur
non-scolarisation, enseignement primaire
|
1=Option cochée
0=Option non cochée
|
négatif
|
|
Lack_of_finance_sec
|
Le manque de moyens financiers comme justificatif de leur
non-scolarisation, enseignement secondaire
|
1=Option cochée
0=Option non cochée
|
négatif
|
ANNEXE 8 :
Contrôle du biais de point de départ : Test des moyennes de
Student
Tableau 14 : Contrôle du biais de point de
départ : Test des moyennes de Student, enseignement
primaire
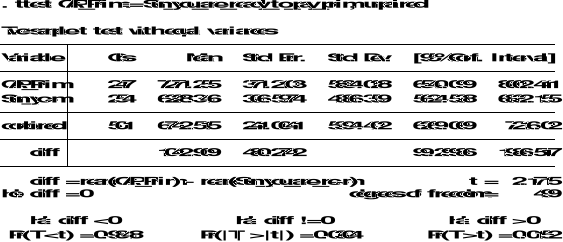
Source : Auteur, à partir des résultats
de la base de données sur STATA 12, 2012
Tableau 15 : Contrôle du biais de point de
départ : Test des moyennes de Student, enseignement secondaire
général
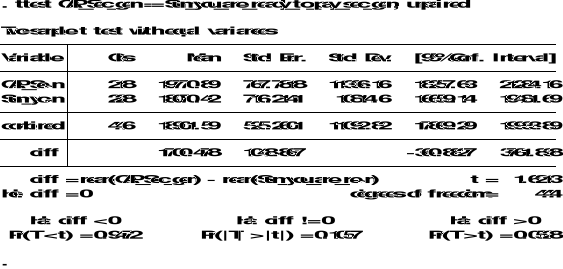
Source : Auteur, à partir des résultats
de la base de données sur STATA 12, 2012
Tableau 16 : Contrôle du biais de point de
départ : Test des moyennes de Student, enseignement secondaire
technique
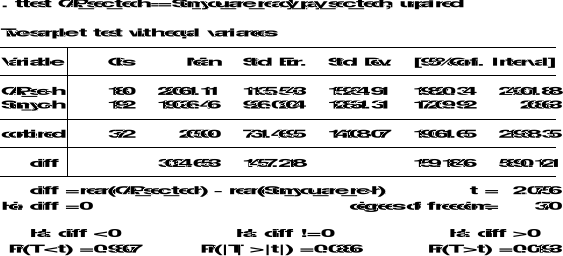
Source : Auteur, à partir des résultats
de la base de données sur STATA 12, 2012
ANNEXE 9 : Estimation des
résultats du modèle
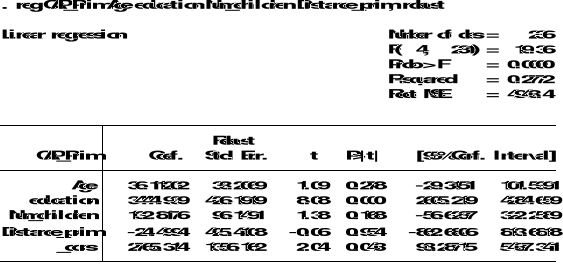
Tableau 17 : Estimation des résultats du
modèle, enseignement primaire
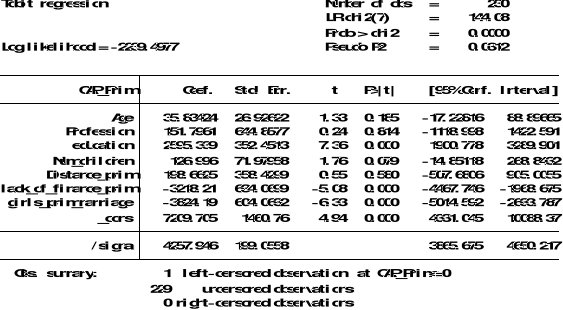
Source : Auteur, à partir des résultats
de la base de données sur STATA 12, 2012
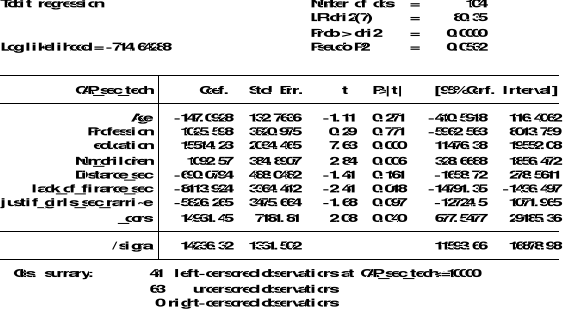
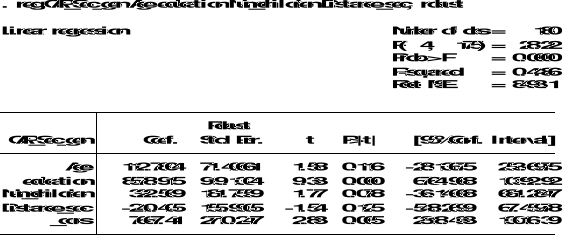
Tableau 18 : Estimation des résultats du
modèle, enseignement secondaire général

Source : Auteur, à partir des résultats
de la base de données sur STATA 12, 2012
Tableau 19 : Estimation des résultats du
modèle,
Source : Auteur, à partir des résultats
de la base de données sur STATA 12, 2012
ANNEXE 10 : Test
d'homoscédasticité: Test de White
Tableau 20 : Test
d'homoscédasticité, enseignement primaire
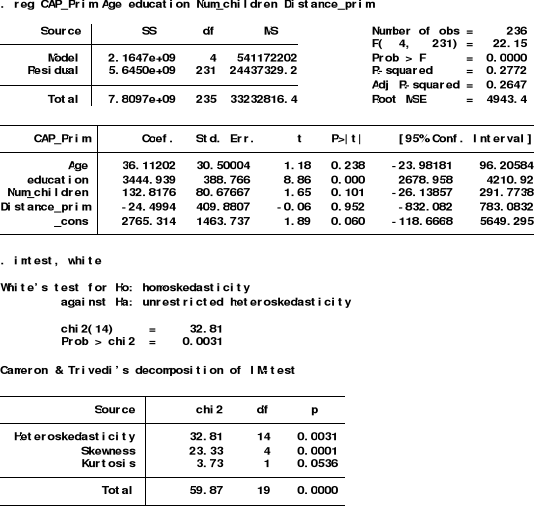
Source : Auteur, à partir des résultats
de la base de données sur STATA 12, 2012
Tableau 21 : Test
d'homoscédasticité, enseignement secondaire général
et technique
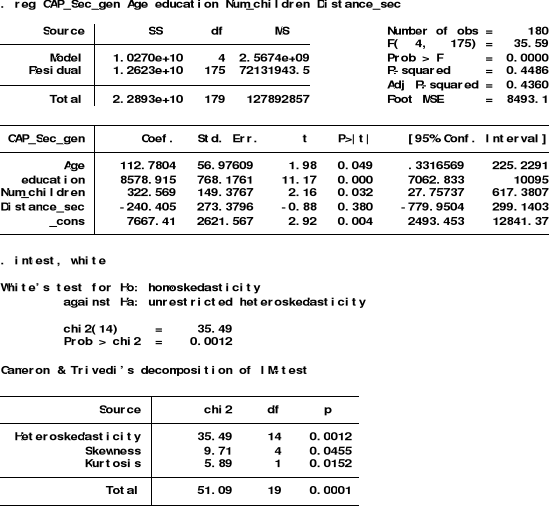
Source : Auteur, à partir des résultats
de la base de données sur STATA 12, 2012
Tableau 22 : Correction de
l'hétéroscédasticité, enseignement
primaire
Source : Auteur, à partir des résultats
de la base de données sur STATA 12, 2012
Tableau 23 : Correction de
l'hétéroscédasticité, enseignement secondaire
général et technique
Source : Auteur, à partir des résultats
de la base de données sur STATA 12, 2012
ANNEXE 11 : la prédiction des
effets marginaux
Tableau 24 : Prédiction des effets
marginaux, enseignement primaire
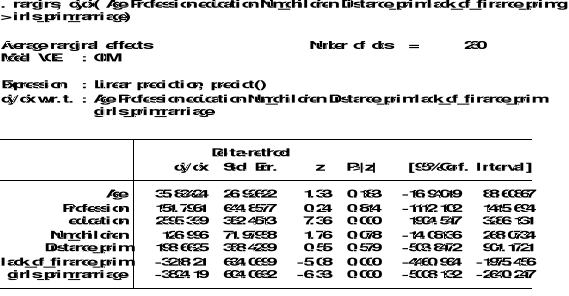
Source : Auteur, à partir des résultats
de la base de données sur STATA 12, 2012
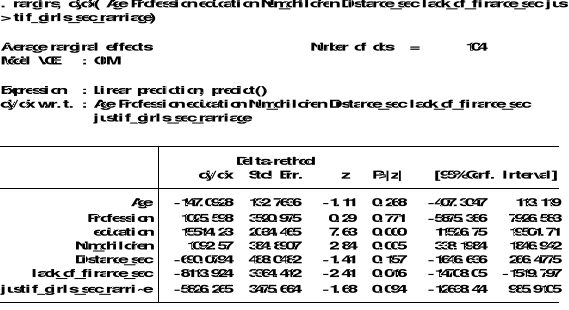
Tableau 25: Prédiction des effets
marginaux, enseignement secondaire général
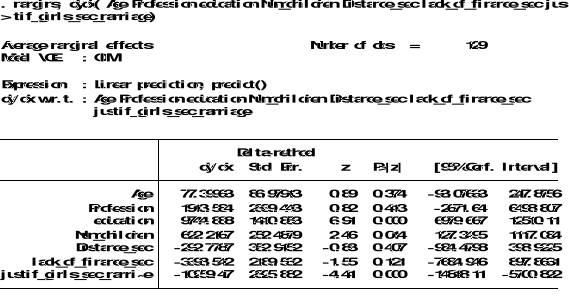
Source : Auteur, à partir des résultats
de la base de données sur STATA 12, 2012
Tableau 26 : Prédiction des effets
marginaux, enseignement secondaire technique
Source : Auteur, à partir des résultats
de la base de données sur STATA 12, 2012
| 

