4.4 Binding reaction of hemin with artemisinin
drugs.
![]()
![]()
4.4.1 Binding reaction of hemin with artemisinin,
dihydroartemisinin and artesunate in water-DMSO mixture.
![]()
![]()
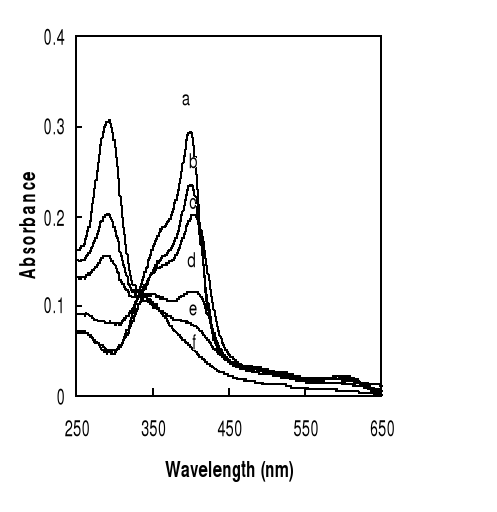
Figure 4-4 Spectroscopic changes of
Fe(III)PPIX at Soret band (402 nm) as a function of increasing concentartions
of drug :
0 (a), 1.4 (b), 2.4 (c), 70 (d), 100 (e), 160 M of DHA (f)
after 10 hours,
0 (a), 6 (b), 14 (c), 24 (d), 50 (e), 120 M of DHA (f) after
24 hours,
0 (a), 3 (b), 10 (c), 50 (d), 120 (e), 160 M of AST (f) after
24 hours,
0 (a), 14 (b), 18 (c), 70 (d), 100 (e), 160 M of ART (f) after
24 hours with 40 % DMSO aqueous as solvent and 0.1 M Tris-HCl buffer (pH
9).
Typical spectral changes observed upon hemin-sesquiterne
endoperoxide lactone-based drugs complexation are shown in figure 4-4. They are
similar to those observed on hemin-artesunate and hemin-artemisinin
interactions in other mediums (Berman and Adams, 1997, Bilia et al., 2002).
The wavelength of 402 nm was selected to determine the
constants of complexation. Complex formation was monitored by the decline in
Absorbance (402 nm) whereas absorbance of hemin, incubated with drug, was
essentially unchanged after 24 hrs.
The spectral changes resulting from addition of quinoline
based drug to Fe(III)PPIX and those resulting from artemisinin drug-hemin
interaction are different. The latter shows a substantial hypochromic effect of
the hemin Soret band at 402 nm, accompanied with a red shift of 2-5 nm, whereas
in bonding of hemin with quinoline, the peak maximums are still at about 396nm.
It means that artemisinin and derivatives are auxochromes because their
reaction to hemin leads to red shift, which is clearly apparent after 10 hours.
The new peak around 407nm may belong to the complex.
About the decrease in absorbance of the Soret band of hemin,
two possible processes can be envisaged which would lead to these changes.
Either addition of micromolar concentrations of drug induces aggregation of
hemin or the changes reflect drug association with hemin. While a large
decrease in the absorbance of the Soret band is often an indication of
aggregation, equally large decreases are caused by formation of p-p
(donor-acceptor) complexes (Egan et al., 1997). Generally, spectral changes of
iron porphyrins in the visible region vary depending on the conditions of
solvents and pH and the nature of interacting species. The decrease of hemin
absorbance is dependent on the drug concentration. A dilution experiment showed
that Beer's law is strictly adhered to in the presence of 306 M drug and in the
concentration range 0.99 to 48 M Fe(III)PPIX thus providing no evidence of
hemin aggregation in this concentration range. Thus, the most reasonable
explanation for these spectral changes is the presence of drug-hemin
association. There is another feature on the titration curves of artemisinin
and derivatives, i.e. a quite regular spectral changes over time with a
well-defined isosbetic point around 325 nm. This behaviour is suggestive of an
equilibrium between two species. These spectral modifications suggest a
progressive disruption of delocalised -electron system of the hemin
tetrapyrrole ring. In addition, another band at 290 nm with low intensity was
also observed, the origin of that is unclear at this time. Without drug, the
band of hemin was still unchanged after 24hours.
Typical kinetic analysis of the mixture of hemin plus
artesiminin and derivatives are shown in Figure 9. For example, for 24 M of
drug (at pH 9), the residual intensity of the soret band, compared to the
control (hemin, 100%), is:
after 10h, 84% (ART), 83 % (AST), 59% (DHA)
after 24h, 66% (ART), 57 % (AST), 37 % (DHA)
Figure 4-5 Variation of absorbance at 402 nm
observed when hemin is titrated with artemisinin derivatives (24 M) within 60
hours of observation in 0.1 M Tris buffer (pH 9, 37oC).
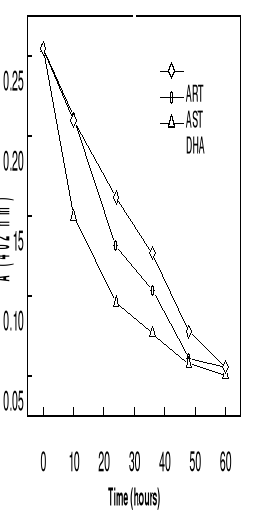
At 37oC, the curves of absorbance-time
relationship for the complexation showed that the time taken to reach
absorbance minimun is shorter for DHA. It was found that the reaction rate is
faster with dihydroartemsinin, followed by artesunate than artemisinin did.
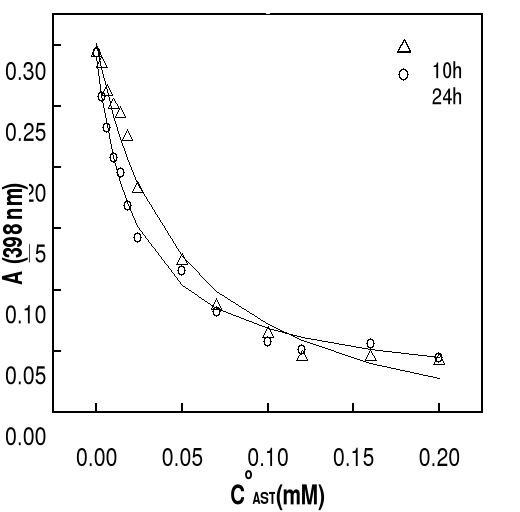
Some typical titration curves have been shown in Figures 4-6
and 4-7.
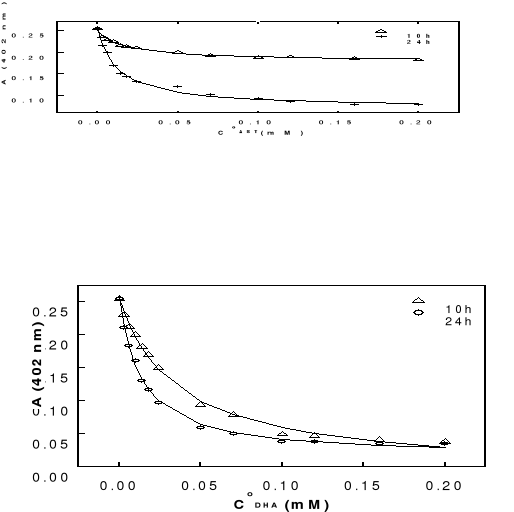
Figure 4-6 Variation in
absorbance of hemin at 402 nm as function of total concentartion of artemisinin
-based drugs after 10 and 24 hours of incubation at 37oC (pH 9).
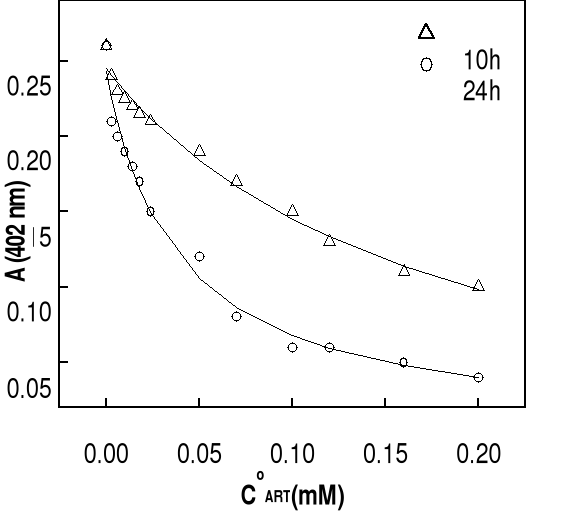
The solid lines are best fits of the data to a 1:1 association
model obtained by nonlinear least-squares analysis. Association constants for
all of the compounds are summarized in Table 4-2. It should be pointed out that
the conditions under which the association constants have been measured are of
course quite different from those in food vacuole of the parasite (pH~ 5.4,
acidic aqueous medium). These are only apparent or conditional association
constants. It can be seen that the extinction of the hemin solution decreases
with increasing in total drug concentration. Generally, at drug concentrations
smaller than 50 M (molar ratio hemin / drug =1:17), there is a significantly
and progressive decay in Soret absorbance, more perceptible in the case of DHA.
At highest concentrations of drug (molar ratio hemin / drug 1: 25), this
decrease is less significant, indicating the saturation of drug binding to
heme. Correlation coefficients of the non linear fittings are better than 0.9,
which implies that the titration curves can be well describes by the 1:1
association between drug and Fe(III)PPIX. Similar variation in absorbance of
hemin at 402 nm as function of total drug concentration has been obtained at pH
7.4 and the results are also consistent with the formation of 1:1 complex.
Values of binding constants at related pH obtained from these titration curves
are summarized in Table 4-2.
Figure 4-7 Variation in
absorbance of hemin at 402 nm as function of total concentration of
artemisinin-based drugs after 24 hours of incubation at 37oC (pH
9).
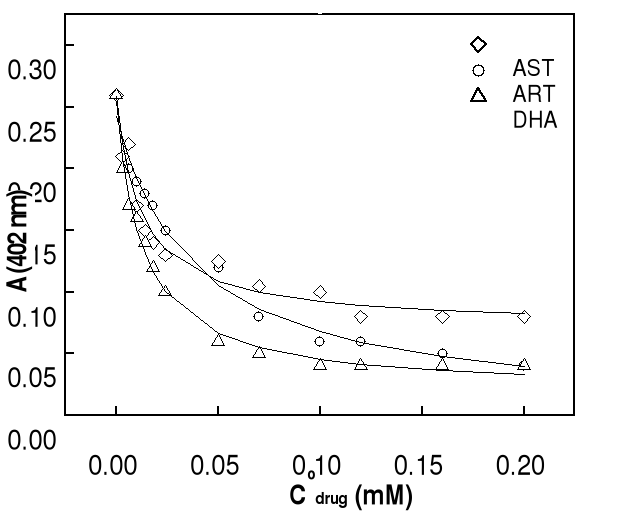
Table 4-2 Binding constant
of hemin-drug complexes in 40 % DMSO, pH 9,
0.1M Tris-HCl buffer
|
pH
|
K (105 M)
|
|
Hemin-DHA
|
Hemin-AST
|
Hemin-ART
|
|
10 hrs
|
24 hrs
|
10 hrs
|
24 hrs
|
10 hrs
|
24 hrs
|
|
9
|
0.28 0.03
|
0.76 0.06
|
0.65 0.15
|
0.82 0.07
|
0.06 0.02
|
0.26 0.04
|
|
7.4
|
-
|
-
|
0.37 0.06
|
0.65 0.05
|
-
|
-
|
4.4.2 Binding reaction of hemin with artesunate in
water-propylene glycol mixture.
10 hrs
![]()
Because of insolubility of artesiminin and dihydroartemisinin
in water-propylene glycol mixture, we only reported the bonding reaction of
hemin with artesunate in this medium. Figure 4-8 shows typical spectral changes
observed when hemin is titrated with artesunate. The wavelength of 398nm was
selected to determine the constants of complexation. The main spectroscopic
changes consist of a red shift of about 3-4 nm and a decrease in intensity of
the Soret band. In addition, the spectra of artesunate showed another
absorption peak at 290 nm, already observed in DMSO aqueous medium. The
titration curves showed, in the range 250-650 nm, a quite regular spectral
change over time with a well-defined isosbetic point around 330 nm.

Figure 4-8 Spetroscopic changes of
Fe(III)PPIX Soret band (398nm) as a function of increasing concentartions of
drug :
AST (10 h): 0 (a), 1.4 (b), 2.4 (c), 70 (d), 120 (e), 160 M
of AST (f) after 10 hours,
AST (24 h): 0 (a), 6 (b), 14 (c), 50 (d), 70 (e), 160 M of
AST (f) after 24 hours with water-propylene glycol mixture as solvent and 0.1 M
Tris-HCl buffer (pH 9).
24 hrs
Similar variation in absorbance of hemin at 402 nm as function
of total drug concentration has been obtained at pH 7.4 and the results are
also consistent with the formation of 1:1 complex as shown in Figure 4-9.
Figure 4-9 Variation in absorbance of hemin
at 398 nm as function of total concentration of artesunate (pH 9) after 10 or
24 hours of incubation at 37oC.
Values of binding constants at related pH obtained from these
titration curves are summarized in Table 4-3.
Table
4-3 Binding constant of hemin-drug complexes in water-
propylene glycol at pH 9, in 0.1M
Tris-HCl buffer.
|
pH
|
K ( 105 M)
|
|
Hemin-artesunte
|
|
10 hrs 24hrs
|
|
9.0
|
0.21 0.04
|
0.43 0.06
|
|
7.4
|
0.33 0.07
|
0.60 0.08
|
In the light of above results, we observed that fixing the
concentration of hemin at 3 M and varying drug from 0 to 200 M, the Soret band
of hemin decreased. Along with the increase in incubation time and drug
concentration, it arises a new peak centred at 290 nm, indicating that the peak
belongs to artemisinin compounds. The origin of which is unclear at this time
but we suggested that it is a decomposed product of artemisinin as a result of
reaction between hemin and drugs. The spectral propriety of this product with
strong absorbance is similar to that observed by Green and co-workers (Green et
al., 2000) caused by alkali decomposition of ART. They called it ARTS 290 and
have described this compound as an enolate/carboxylate. Enolates readily couple
to electrophilic dyes such as diazonium salts (Zollinger, 1991), therefore it
is possible that
Figure 4-10. Spectral
changes of the alkali decomposition product of 0.001 M artesunate to 1 M NaOH
after 20 min.
![]()
the alkali decomposition product of ART may be similar in
structure. In order to verify this assertion, we mixed 0.001 M of AST with 1M
of NaOH at room temperature for 20 min. We observed exactly a peak at 290 nm,
which has the same characteristic of ART 290 as shown in figure 4-10.
It has been postulated that the interaction of artemisininn
with the target heme or hemin in vivo proceeds through the complexes, in which
the peroxide bridge of trioxanes coordinates with the iron of hemin, leading to
the formation of drug-hemin adduct.
This long-lived intermediate has the spectral characteristics
of a heme peroxide (Berman and dams, 199)] compound analogous, in which the
hemin is covalently bound to artemisinin via a iron-oxygen-carbon bond, formed
by attack of the iron center on the endoperoxide group of drug. This metastable
species gradually decays over the ensuing (24 hours for drug highest
concentration or 48 hours for drug lowest concentration), to final product
devoid of Soret absorbance, indicative of disruption of the heme tetrapyrrole
ring system.
Based on data in Tables 4-2 and 4-3, AST should have greater
affinity with hemin, then DHA and finally ART. In regard to their constants
bindings values, AST and DHA should have the highest efficiency than ART.
Practically, it has been shown that artemisinin derivates are at least five
times higher than artemisinin. In regard to their molecular structure (Scheme
4-2) it is probably that succininic group of artesunate interacts with hemin
propionic group via intra-molecular hydrogen bonding and make this bonding
stronger than that of artemisinin does. In addition, in vivo metabolism,
artemisinin and derivatives (artesunate, arteether, artemether) are hydrolyzed
mainly to the active derivative DHA. DHA, a first generation analogous and
metabolite of ART, is known with artesunate to be therapeutically more active
than artemisinin (China Cooperative Research Group, 1982, Kamchonwongpaisan and
Meshnick, 1996). It was demonstrated too by analyzing the reaction products of
DHA plus hemoglobin and of DHA plus globin, DHA reacted rapidly with hemoglobin
(as shown in spectral changes in Figure 4-4) but not with globin. This may be a
major reason for fast action of these drugs compared to quinoline
antimalarials. This is supported equally by the binding constants values
(calculated in water propylene glycol mixture) of artesunate (0.43) which are
higher than chloroquine (0.17) and quinine (0.05) do. In pratical applications,
a similar trend is observed because artemisinin compounds are now at the top of
list of new antimalarial drugs in terms of efficacy, rapidity of action and
first order pharmacokinetic against chloroquine -resistant strains of
plasmodium.
Our results showed that the physical property of the medium of
reaction affects the rate of interaction between hemin and drug. We supposed
that because of the weak dielectric constants of DMSO and PREG compared to that
of water, the bonding constant values of the related artemisinin drug would be
more greater in aqueous medium.
Water solubility of artesunate may be due to the presence of
succinc group, which increases its polarity make it distinct from other
derivatives. DMSO which is highly polar aprotic solvent, with negligible
hydrogen bond donation compared to water, may be solvate artesunate anion
only through ion-dipole interactions. Less an anionic ligand is
solvated, the more readily the complex is formed. From literature, it is known
aprotic dipolar solvent permit good complexation while allowing also reasonable
solubility of the reacting species (Marcus, 1999). Then, artesunate could
coordinate strongly with hemin. The structure of artemisinin-hemin complexes
are not well known, may be they are transfert-charge complexes.
In water-DMSO mixture, the binding of hemin to artesunate is
better than that in water-propylene glycol. In fact, the propylene glycol, with
high viscosity, may be decrease significantly the reactivity of artesunate in
this medium than water-dimethyl sulfoxide does.
The interaction of hemin and artemisinin compounds is
supported too by molecular mechanic calculations. The molecular electrostatic
potentiel (MEP) of artemisinin showed that it has two main region with negative
potential which may interact with the positively charged iron ion of the heme,
one of these regions covers endoperoxide oxygen O1 and O2 whereas the other
encompasses the carboxyl oxygen atom 011 and O14 (Scheme 2-2). This suggests
that electrostatic interaction between artemisinin and heme can involve large
part of the artemisinin structure. However, the carboxyl and peroxide oxygen
atoms, which been the most electronegative part of molecule, will probably be
more competitive for complexation (Shukla et al., 1995). In addition,
Tonmunphen and co-workers reported automated molecular docking of artemisinin
to heme. The docking between artemisinin and heme indicated that artemisinin
approaches heme by pointing O1 at the peroxide linkage toward the iron center,
a mechanism that is controlled by steric hindrance whith a lowest binding
energy of -33.13 kcal.mol-1 (Tonmunphen et al., 2001, Taranto et
al., 2001). This is probably due to pyramidal geometry of hemin (where iron is
out of the main plan formed by the four pyrrole N atoms) which facilitates the
approach of Fe to the endoperoxide moiety.
|