WEBOGRAPHIE
http://www.fenapec.cd/economie-rdc.
TABLE DES MATIERES
Pages
DEDICACE
REMERCIEMENTS
LISTE DES ACRONYMES
0.INTRODUCTION
1
0.1. ETAT DE LA QUESTION
1
0.2. PROBLEMATIQUE
4
0.3. HYPOTHESES
8
0.4. OBJECTIFS DU TRAVAIL
9
0.5. INTERETS DU TRAVAIL
10
0.6. METHODES ET TECHNIQUES
10
0.7. DELIMITATION DU TRAVAIL
10
0.8. SUBDIVISION DU TRAVAIL
11
Chapitre un :
CONSIDERATIONS GENERALES
12
Section 1 : CADRE THEORIQUE
12
I.1.1. Elucidation des concepts usuels
12
I.1.2. Théorie sur le financement d'une
économie
17
I.1.3. Liminaires théoriques de la croissance
économique
23
I.1.4. Notion sur le développement
économique
26
Section 2 : APPROCHE METHODOLOGIQUE
30
I.2.1. Méthode
30
I.2.2. Technique
30
I.2.3. Méthodes utilisées
31
I.2.4. Techniques utilisées et documents
consultés
31
I.2.5. Aperçu théorique de la
modélisation Var
32
Chapitre deux :
FINANCEMENT EXTERIEUR DE L'ECONOMIE
DE LA REPUBLIQUE DEMOCRATIQUE
DU CONGO
38
Section 1 : BREF APERÇU SUR LE MODE DE
FINANCEMENT EXTERIEUR DE L'ECONOMIE CONGOLAISE
38
II.1.1. L'entrée en programme avec les
Institutions de Bretton Woo
38
I.1.2. La suspension de programme avec les
Institutions de Bretton Woods après le pillage de 1991 et 1993
42
II.1.3. Reprise de programme en 2003 avec les
institutions de Bretton Woods
43
II.1.4. L'impact des investissements chinois sur le
financement du développement de la RDC
51
Chapitre trois :
PRESENTATION, ANALYSE
DES DONNEES ET INTERPRETATION
DES RESULTATS
57
Section 1 : PRESENTATION ET ANALYSE DES DONNEES
57
III.1.1. Analyse descriptive des données
59
III.1.2. Analyse de la stationnarité des
données et test de cointégration
61
III.1.3. Estimation et spécification du
modèle
64
III.1.4. Tests économétriques
66
III.1.5. Test de causalité de Grange
68
III.1.6. Conclusion sur la validité du
modèle
68
Section 2 : INTERPRETATION DE RESULTAT
69
Section 3 : DISCUSSION
70
CONCLUSION
73
BIBLIOGRAPHIE
77
WEBOGRAPHIE
80
TABLE DES MATIERES
81
ANNEXES
ANNEXES
1 .Test d'ADF sur le taux de
croissance
|
Null Hypothesis: D(TCE) has a unit root
|
|
|
Exogenous: None
|
|
|
|
Lag Length: 0 (Automatic based on SIC, MAXLAG=7)
|
|
|
|
|
|
|
|
|
|
|
|
|
|
t-Statistic
|
Prob.*
|
|
|
|
|
|
|
|
|
|
|
|
Augmented Dickey-Fuller test statistic
|
-4.989548
|
0.0000
|
|
Test critical values:
|
1% level
|
|
-2.650145
|
|
|
5% level
|
|
-1.953381
|
|
|
10% level
|
|
-1.609798
|
|
|
|
|
|
|
|
|
|
|
|
2 .Test d'ADF sur les Dettes
Extérieures
|
Null Hypothesis: D(DEXT) has a unit root
|
|
|
Exogenous: None
|
|
|
|
Lag Length: 0 (Automatic based on SIC, MAXLAG=7)
|
|
|
|
|
|
|
|
|
|
|
|
|
|
t-Statistic
|
Prob.*
|
|
|
|
|
|
|
|
|
|
|
|
Augmented Dickey-Fuller test statistic
|
-3.428795
|
0.0013
|
|
Test critical values:
|
1% level
|
|
-2.650145
|
|
|
5% level
|
|
-1.953381
|
|
|
10% level
|
|
-1.609798
|
|
|
|
|
|
|
|
|
|
|
|
3. Test d'ADF sur l'Indicateur de
Développement humain
|
Null Hypothesis: D(IDH) has a unit root
|
|
|
Exogenous: Constant
|
|
|
|
Lag Length: 1 (Automatic based on SIC, MAXLAG=7)
|
|
|
|
|
|
|
|
|
|
|
|
|
|
t-Statistic
|
Prob.*
|
|
|
|
|
|
|
|
|
|
|
|
Augmented Dickey-Fuller test statistic
|
-5.225590
|
0.0002
|
|
Test critical values:
|
1% level
|
|
-3.699871
|
|
|
5% level
|
|
-2.976263
|
|
|
10% level
|
|
-2.627420
|
|
|
|
|
|
|
4. Test de stationnarité des résidus
|
Null Hypothesis: RESIDS has a unit root
|
|
|
Exogenous: Constant, Linear Trend
|
|
|
Lag Length: 0 (Automatic based on SIC, MAXLAG=7)
|
|
|
|
|
|
|
|
|
|
|
|
|
|
t-Statistic
|
Prob.*
|
|
|
|
|
|
|
|
|
|
|
|
Augmented Dickey-Fuller test statistic
|
-1.974635
|
0.5902
|
|
Test critical values:
|
1% level
|
|
-4.309824
|
|
|
5% level
|
|
-3.574244
|
|
|
10% level
|
|
-3.221728
|
|
|
|
|
|
|
|
|
|
|
|
|
*MacKinnon (1996) one-sided p-values.
|
|
|
|
|
|
|
|
|
|
|
|
|
Augmented Dickey-Fuller Test Equation
|
|
|
Dependent Variable: D(RESIDS)
|
|
|
Method: Least Squares
|
|
|
|
Date: 06/23/11 Time: 13:55
|
|
|
|
Sample (adjusted): 1981 2009
|
|
|
|
Included observations: 29 after adjustments
|
|
|
|
|
|
|
|
|
|
|
|
|
Variable
|
Coefficient
|
Std. Error
|
t-Statistic
|
Prob.
|
|
|
|
|
|
|
|
|
|
|
|
RESIDS(-1)
|
-0.248202
|
0.125695
|
-1.974635
|
0.0590
|
|
C
|
-1.170425
|
1.384941
|
-0.845108
|
0.4058
|
|
@TREND(1980)
|
0.080759
|
0.081187
|
0.994720
|
0.3290
|
|
|
|
|
|
|
|
|
|
|
|
R-squared
|
0.136403
|
Mean dependent var
|
0.070216
|
|
Adjusted R-squared
|
0.069973
|
S.D. dependent var
|
3.638580
|
|
S.E. of regression
|
3.508971
|
Akaike info criterion
|
5.446220
|
|
Sum squared resid
|
320.1348
|
Schwarz criterion
|
5.587664
|
|
Log likelihood
|
-75.97019
|
F-statistic
|
2.053324
|
|
Durbin-Watson stat
|
1.769849
|
Prob(F-statistic)
|
0.148608
|
|
|
|
|
|
5. Estimation du Modèle Var
|
Vector Autoregression Estimates
|
|
|
Date: 06/23/11 Time: 14:06
|
|
|
Sample (adjusted): 1981 2009
|
|
|
Included observations: 29 after adjustments
|
|
Standard errors in ( ) & t-statistics in [ ]
|
|
|
|
|
|
|
|
|
|
TCE
|
DEXT
|
IDH
|
|
|
|
|
|
|
|
|
|
TCE(-1)
|
0.765832
|
40.80178
|
1.76E-06
|
|
(0.11910)
|
(22.3547)
|
(0.00019)
|
|
[ 6.43001]
|
[ 1.82520]
|
[ 0.00910]
|
|
|
|
|
|
DEXT(-1)
|
-0.001056
|
1.015734
|
-2.83E-06
|
|
(0.00063)
|
(0.11895)
|
(1.0E-06)
|
|
[-1.66641]
|
[ 8.53944]
|
[-2.74922]
|
|
|
|
|
|
IDH(-1)
|
-138.1215
|
6640.172
|
0.536359
|
|
(83.1282)
|
(15602.6)
|
(0.13509)
|
|
[-1.66155]
|
[ 0.42558]
|
[ 3.97052]
|
|
|
|
|
|
C
|
62.89689
|
-2459.681
|
0.204382
|
|
(37.3664)
|
(7013.41)
|
(0.06072)
|
|
[ 1.68325]
|
[-0.35071]
|
[ 3.36589]
|
|
|
|
|
|
|
|
|
|
R-squared
|
0.653557
|
0.924713
|
0.888404
|
|
Adj. R-squared
|
0.611984
|
0.915679
|
0.875012
|
|
Sum sq. resids
|
298.6585
|
10521298
|
0.000789
|
|
S.E. equation
|
3.456348
|
648.7310
|
0.005617
|
|
F-statistic
|
15.72065
|
102.3545
|
66.34074
|
|
Log likelihood
|
-74.96329
|
-226.7727
|
111.2815
|
|
Akaike AIC
|
5.445744
|
15.91536
|
-7.398721
|
|
Schwarz SC
|
5.634336
|
16.10395
|
-7.210129
|
|
Mean dependent
|
-0.113674
|
7975.702
|
0.395448
|
|
S.D. dependent
|
5.548716
|
2234.067
|
0.015887
|
|
|
|
|
|
|
|
|
|
Determinant resid covariance (dof adj.)
|
149.2095
|
|
|
Determinant resid covariance
|
95.59224
|
|
|
Log likelihood
|
-189.5690
|
|
|
Akaike information criterion
|
13.90131
|
|
|
Schwarz criterion
|
14.46709
|
|
|
|
|
|
|
|
|
|
6. Test de normalite de Jarque
Bera(jb)
251658240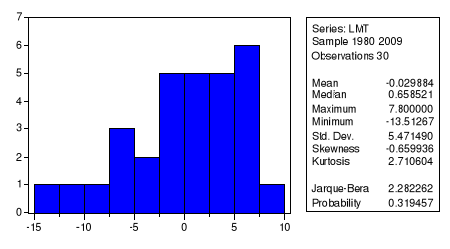
7. Test du multiplicateur de la grange (lm
test)
|
Breusch-Godfrey Serial Correlation LM Test:
|
|
|
|
|
|
|
|
|
|
|
|
|
F-statistic
|
1.407955
|
Probability
|
0.262376
|
|
Obs*R-squared
|
15.89141
|
Probability
|
0.196261
|
|
|
|
|
|
|
|
|
|
|
|
|
|
|
|
|
Test Equation:
|
|
|
|
Dependent Variable: RESID
|
|
|
|
Method: Least Squares
|
|
|
|
Date: 07/06/11 Time: 22:08
|
|
|
|
Presample missing value lagged residuals set to zero.
|
|
|
|
|
|
|
|
|
|
|
|
Variable
|
Coefficient
|
Std. Error
|
t-Statistic
|
Prob.
|
|
|
|
|
|
|
|
|
|
|
|
C
|
11.36249
|
14.30970
|
0.794041
|
0.4396
|
|
DEXT
|
0.037762
|
0.150731
|
0.250524
|
0.8056
|
|
IDH
|
-28.13148
|
35.96178
|
-0.782261
|
0.4462
|
|
RESID(-1)
|
0.107888
|
0.262642
|
0.410782
|
0.6870
|
|
RESID(-2)
|
-0.300813
|
0.264707
|
-1.136398
|
0.2736
|
|
RESID(-3)
|
-0.139917
|
0.275094
|
-0.508616
|
0.6184
|
|
RESID(-4)
|
-0.435843
|
0.274397
|
-1.588363
|
0.1331
|
|
RESID(-5)
|
-0.440951
|
0.288459
|
-1.528641
|
0.1472
|
|
RESID(-6)
|
-0.412420
|
0.306563
|
-1.345301
|
0.1985
|
|
RESID(-7)
|
-0.175219
|
0.312722
|
-0.560301
|
0.5835
|
|
RESID(-8)
|
-0.019567
|
0.301011
|
-0.065006
|
0.9490
|
|
RESID(-9)
|
-0.191976
|
0.276954
|
-0.693167
|
0.4988
|
|
RESID(-10)
|
-0.084845
|
0.286107
|
-0.296550
|
0.7709
|
|
RESID(-11)
|
-0.266833
|
0.286995
|
-0.929748
|
0.3672
|
|
RESID(-12)
|
0.011530
|
0.303333
|
0.038011
|
0.9702
|
|
|
|
|
|
|
|
|
|
|
|
R-squared
|
0.529714
|
Mean dependent var
|
5.92E-17
|
|
Adjusted R-squared
|
0.090780
|
S.D. dependent var
|
3.083307
|
|
S.E. of regression
|
2.940028
|
Akaike info criterion
|
5.301568
|
|
Sum squared resid
|
129.6564
|
Schwarz criterion
|
6.002166
|
|
Log likelihood
|
-64.52352
|
F-statistic
|
1.206818
|
|
Durbin-Watson stat
|
1.959952
|
Prob(F-statistic)
|
0.360242
|
|
|
|
|
|
|
|
|
|
|
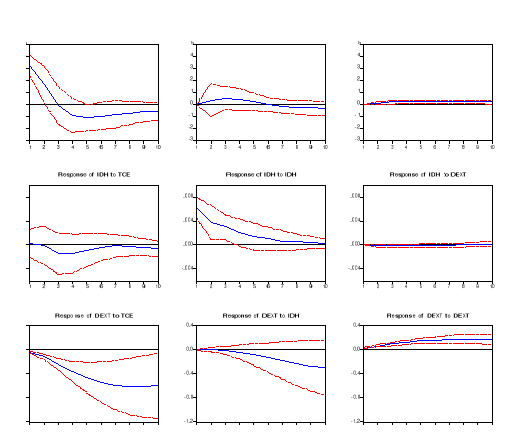
2516556808. Impact du choc entre les variables
(réponses impulsionnelles)
| 

