ANNEXE
Annexe 1
TEST DE STATIONNARITE
A NIVEAU
LPIB
|
Null Hypothesis: LPIB has a unit root
|
|
|
Exogenous: Constant, Linear Trend
|
|
|
Lag Length: 0 (Automatic based on SIC, MAXLAG=7)
|
|
|
|
|
|
|
|
|
|
|
|
|
|
t-Statistic
|
Prob.*
|
|
|
|
|
|
|
|
|
|
|
|
Augmented Dickey-Fuller test statistic
|
-2.617705
|
0.2755
|
|
Test critical values:
|
1% level
|
|
-4.284580
|
|
|
5% level
|
|
-3.562882
|
|
|
10% level
|
|
-3.215267
|
|
|
|
|
|
|
|
|
|
|
|
|
*MacKinnon (1996) one-sided p-values.
|
|
|
|
|
|
|
|
|
|
|
|
|
Augmented Dickey-Fuller Test Equation
|
|
|
Dependent Variable: D(LPIB)
|
|
|
|
Method: Least Squares
|
|
|
|
Date: 04/08/09 Time: 14:55
|
|
|
|
Sample (adjusted): 1977 2007
|
|
|
|
Included observations: 31 after adjustments
|
|
|
|
|
|
|
|
|
|
|
|
|
Variable
|
Coefficient
|
Std. Error
|
t-Statistic
|
Prob.
|
|
|
|
|
|
|
|
|
|
|
|
LPIB(-1)
|
-0.393122
|
0.150178
|
-2.617705
|
0.0141
|
|
C
|
10.43200
|
3.970800
|
2.627178
|
0.0138
|
|
@TREND(1976)
|
0.014456
|
0.005589
|
2.586475
|
0.0152
|
|
|
|
|
|
|
|
|
|
|
|
R-squared
|
0.196612
|
Mean dependent var
|
0.037635
|
|
Adjusted R-squared
|
0.139227
|
S.D. dependent var
|
0.045701
|
|
S.E. of regression
|
0.042400
|
Akaike info criterion
|
-3.391553
|
|
Sum squared resid
|
0.050338
|
Schwarz criterion
|
-3.252780
|
|
Log likelihood
|
55.56907
|
F-statistic
|
3.426199
|
|
Durbin-Watson stat
|
2.029985
|
Prob(F-statistic)
|
0.046661
|
|
|
|
|
|
|
|
|
|
|
LIT
|
Null Hypothesis: LIT has a unit root
|
|
|
Exogenous: None
|
|
|
|
Lag Length: 1 (Automatic based on SIC, MAXLAG=7)
|
|
|
|
|
|
|
|
|
|
|
|
|
|
t-Statistic
|
Prob.*
|
|
|
|
|
|
|
|
|
|
|
|
Augmented Dickey-Fuller test statistic
|
0.979661
|
0.9093
|
|
Test critical values:
|
1% level
|
|
-2.644302
|
|
|
5% level
|
|
-1.952473
|
|
|
10% level
|
|
-1.610211
|
|
|
|
|
|
|
|
|
|
|
|
|
*MacKinnon (1996) one-sided p-values.
|
|
|
|
|
|
|
|
|
|
|
|
|
Augmented Dickey-Fuller Test Equation
|
|
|
Dependent Variable: D(LIT)
|
|
|
|
Method: Least Squares
|
|
|
|
Date: 04/08/09 Time: 14:59
|
|
|
|
Sample (adjusted): 1978 2007
|
|
|
|
Included observations: 30 after adjustments
|
|
|
|
|
|
|
|
|
|
|
|
|
Variable
|
Coefficient
|
Std. Error
|
t-Statistic
|
Prob.
|
|
|
|
|
|
|
|
|
|
|
|
LIT(-1)
|
0.006198
|
0.006327
|
0.979661
|
0.3356
|
|
D(LIT(-1))
|
0.370886
|
0.177575
|
2.088617
|
0.0460
|
|
|
|
|
|
|
|
|
|
|
|
R-squared
|
0.137904
|
Mean dependent var
|
0.051470
|
|
Adjusted R-squared
|
0.107114
|
S.D. dependent var
|
0.178052
|
|
S.E. of regression
|
0.168246
|
Akaike info criterion
|
-0.662435
|
|
Sum squared resid
|
0.792591
|
Schwarz criterion
|
-0.569022
|
|
Log likelihood
|
11.93653
|
Durbin-Watson stat
|
1.983455
|
|
|
|
|
|
|
|
|
|
|
LDET
|
Null Hypothesis: LDET has a unit root
|
|
|
Exogenous: Constant
|
|
|
|
Lag Length: 1 (Automatic based on SIC, MAXLAG=7)
|
|
|
|
|
|
|
|
|
|
|
|
|
|
t-Statistic
|
Prob.*
|
|
|
|
|
|
|
|
|
|
|
|
Augmented Dickey-Fuller test statistic
|
-2.649293
|
0.0947
|
|
Test critical values:
|
1% level
|
|
-3.670170
|
|
|
5% level
|
|
-2.963972
|
|
|
10% level
|
|
-2.621007
|
|
|
|
|
|
|
|
|
|
|
|
|
*MacKinnon (1996) one-sided p-values.
|
|
|
|
|
|
|
|
|
|
|
|
|
Augmented Dickey-Fuller Test Equation
|
|
|
Dependent Variable: D(LDET)
|
|
|
|
Method: Least Squares
|
|
|
|
Date: 04/08/09 Time: 15:01
|
|
|
|
Sample (adjusted): 1978 2007
|
|
|
|
Included observations: 30 after adjustments
|
|
|
|
|
|
|
|
|
|
|
|
|
Variable
|
Coefficient
|
Std. Error
|
t-Statistic
|
Prob.
|
|
|
|
|
|
|
|
|
|
|
|
LDET(-1)
|
-0.110990
|
0.041894
|
-2.649293
|
0.0133
|
|
D(LDET(-1))
|
0.408238
|
0.176157
|
2.317468
|
0.0283
|
|
C
|
2.979375
|
1.117642
|
2.665768
|
0.0128
|
|
|
|
|
|
|
|
|
|
|
|
R-squared
|
0.411925
|
Mean dependent var
|
0.078904
|
|
Adjusted R-squared
|
0.368364
|
S.D. dependent var
|
0.263208
|
|
S.E. of regression
|
0.209186
|
Akaike info criterion
|
-0.196542
|
|
Sum squared resid
|
1.181492
|
Schwarz criterion
|
-0.056423
|
|
Log likelihood
|
5.948137
|
F-statistic
|
9.456246
|
|
Durbin-Watson stat
|
1.955451
|
Prob(F-statistic)
|
0.000772
|
|
|
|
|
|
|
|
|
|
|
TO
|
Null Hypothesis: TO has a unit root
|
|
|
Exogenous: None
|
|
|
|
Lag Length: 0 (Automatic based on SIC, MAXLAG=4)
|
|
|
|
|
|
|
|
|
|
|
|
|
|
t-Statistic
|
Prob.*
|
|
|
|
|
|
|
|
|
|
|
|
Augmented Dickey-Fuller test statistic
|
0.120196
|
0.7134
|
|
Test critical values:
|
1% level
|
|
-2.641672
|
|
|
5% level
|
|
-1.952066
|
|
|
10% level
|
|
-1.610400
|
|
|
|
|
|
|
|
|
|
|
|
|
*MacKinnon (1996) one-sided p-values.
|
|
|
|
|
|
|
|
|
|
|
|
|
Augmented Dickey-Fuller Test Equation
|
|
|
Dependent Variable: D(TO)
|
|
|
|
Method: Least Squares
|
|
|
|
Date: 04/08/09 Time: 15:17
|
|
|
|
Sample (adjusted): 1977 2007
|
|
|
|
Included observations: 31 after adjustments
|
|
|
|
|
|
|
|
|
|
|
|
|
Variable
|
Coefficient
|
Std. Error
|
t-Statistic
|
Prob.
|
|
|
|
|
|
|
|
|
|
|
|
TO(-1)
|
0.003477
|
0.028926
|
0.120196
|
0.9051
|
|
|
|
|
|
|
|
|
|
|
|
R-squared
|
-0.011616
|
Mean dependent var
|
1.161290
|
|
Adjusted R-squared
|
-0.011616
|
S.D. dependent var
|
10.73032
|
|
S.E. of regression
|
10.79246
|
Akaike info criterion
|
7.627299
|
|
Sum squared resid
|
3494.317
|
Schwarz criterion
|
7.673557
|
|
Log likelihood
|
-117.2231
|
Durbin-Watson stat
|
1.567838
|
|
|
|
|
|
|
|
|
|
|
TSS
|
Null Hypothesis: TSS has a unit root
|
|
|
Exogenous: None
|
|
|
|
Lag Length: 0 (Automatic based on SIC, MAXLAG=7)
|
|
|
|
|
|
|
|
|
|
|
|
|
|
t-Statistic
|
Prob.*
|
|
|
|
|
|
|
|
|
|
|
|
Augmented Dickey-Fuller test statistic
|
1.536111
|
0.9664
|
|
Test critical values:
|
1% level
|
|
-2.641672
|
|
|
5% level
|
|
-1.952066
|
|
|
10% level
|
|
-1.610400
|
|
|
|
|
|
|
|
|
|
|
|
|
*MacKinnon (1996) one-sided p-values.
|
|
|
|
|
|
|
|
|
|
|
|
|
Augmented Dickey-Fuller Test Equation
|
|
|
Dependent Variable: D(TSS)
|
|
|
|
Method: Least Squares
|
|
|
|
Date: 04/09/09 Time: 14:22
|
|
|
|
Sample (adjusted): 1977 2007
|
|
|
|
Included observations: 31 after adjustments
|
|
|
|
|
|
|
|
|
|
|
|
|
Variable
|
Coefficient
|
Std. Error
|
t-Statistic
|
Prob.
|
|
|
|
|
|
|
|
|
|
|
|
TSS(-1)
|
0.057157
|
0.037209
|
1.536111
|
0.1350
|
|
|
|
|
|
|
|
|
|
|
|
R-squared
|
0.017757
|
Mean dependent var
|
0.806452
|
|
Adjusted R-squared
|
0.017757
|
S.D. dependent var
|
3.360747
|
|
S.E. of regression
|
3.330776
|
Akaike info criterion
|
5.276014
|
|
Sum squared resid
|
332.8220
|
Schwarz criterion
|
5.322272
|
|
Log likelihood
|
-80.77822
|
Durbin-Watson stat
|
2.147827
|
|
|
|
|
|
|
|
|
|
|
LAID
|
Null Hypothesis: LAID has a unit root
|
|
|
Exogenous: Constant, Linear Trend
|
|
|
Lag Length: 0 (Automatic based on SIC, MAXLAG=7)
|
|
|
|
|
|
|
|
|
|
|
|
|
|
t-Statistic
|
Prob.*
|
|
|
|
|
|
|
|
|
|
|
|
Augmented Dickey-Fuller test statistic
|
-2.616882
|
0.2759
|
|
Test critical values:
|
1% level
|
|
-4.284580
|
|
|
5% level
|
|
-3.562882
|
|
|
10% level
|
|
-3.215267
|
|
|
|
|
|
|
|
|
|
|
|
|
*MacKinnon (1996) one-sided p-values.
|
|
|
|
|
|
|
|
|
|
|
|
|
Augmented Dickey-Fuller Test Equation
|
|
|
Dependent Variable: D(LAID)
|
|
|
|
Method: Least Squares
|
|
|
|
Date: 04/08/09 Time: 15:08
|
|
|
|
Sample (adjusted): 1977 2007
|
|
|
|
Included observations: 31 after adjustments
|
|
|
|
|
|
|
|
|
|
|
|
|
Variable
|
Coefficient
|
Std. Error
|
t-Statistic
|
Prob.
|
|
|
|
|
|
|
|
|
|
|
|
LAID(-1)
|
-0.382797
|
0.146280
|
-2.616882
|
0.0141
|
|
C
|
9.387422
|
3.583081
|
2.619930
|
0.0140
|
|
@TREND(1976)
|
0.017765
|
0.008327
|
2.133506
|
0.0418
|
|
|
|
|
|
|
|
|
|
|
|
R-squared
|
0.197456
|
Mean dependent var
|
0.031800
|
|
Adjusted R-squared
|
0.140132
|
S.D. dependent var
|
0.287739
|
|
S.E. of regression
|
0.266818
|
Akaike info criterion
|
0.287266
|
|
Sum squared resid
|
1.993372
|
Schwarz criterion
|
0.426039
|
|
Log likelihood
|
-1.452622
|
F-statistic
|
3.444536
|
|
Durbin-Watson stat
|
1.971555
|
Prob(F-statistic)
|
0.045979
|
|
|
|
|
|
|
|
|
|
|
SDEXP
|
Null Hypothesis: SDEXP has a unit root
|
|
|
Exogenous: Constant, Linear Trend
|
|
|
Lag Length: 1 (Automatic based on SIC, MAXLAG=5)
|
|
|
|
|
|
|
|
|
|
|
|
|
|
t-Statistic
|
Prob.*
|
|
|
|
|
|
|
|
|
|
|
|
Augmented Dickey-Fuller test statistic
|
-3.186189
|
0.1062
|
|
Test critical values:
|
1% level
|
|
-4.296729
|
|
|
5% level
|
|
-3.568379
|
|
|
10% level
|
|
-3.218382
|
|
|
|
|
|
|
|
|
|
|
|
|
*MacKinnon (1996) one-sided p-values.
|
|
|
|
|
|
|
|
|
|
|
|
|
Augmented Dickey-Fuller Test Equation
|
|
|
Dependent Variable: D(SDEXP)
|
|
|
|
Method: Least Squares
|
|
|
|
Date: 04/08/09 Time: 15:10
|
|
|
|
Sample (adjusted): 1978 2007
|
|
|
|
Included observations: 30 after adjustments
|
|
|
|
|
|
|
|
|
|
|
|
|
Variable
|
Coefficient
|
Std. Error
|
t-Statistic
|
Prob.
|
|
|
|
|
|
|
|
|
|
|
|
SDEXP(-1)
|
-0.701195
|
0.220073
|
-3.186189
|
0.0037
|
|
D(SDEXP(-1))
|
-0.118911
|
0.181793
|
-0.654100
|
0.5188
|
|
C
|
25.41770
|
8.598641
|
2.956013
|
0.0065
|
|
@TREND(1976)
|
-0.864643
|
0.329436
|
-2.624619
|
0.0143
|
|
|
|
|
|
|
|
|
|
|
|
R-squared
|
0.432884
|
Mean dependent var
|
-0.310907
|
|
Adjusted R-squared
|
0.367448
|
S.D. dependent var
|
14.37585
|
|
S.E. of regression
|
11.43357
|
Akaike info criterion
|
7.834550
|
|
Sum squared resid
|
3398.888
|
Schwarz criterion
|
8.021376
|
|
Log likelihood
|
-113.5182
|
F-statistic
|
6.615336
|
|
Durbin-Watson stat
|
2.051832
|
Prob(F-statistic)
|
0.001806
|
|
|
|
|
|
|
|
|
|
|
TCH
|
Null Hypothesis: TCH has a unit root
|
|
|
Exogenous: None
|
|
|
|
Lag Length: 0 (Automatic based on SIC, MAXLAG=7)
|
|
|
|
|
|
|
|
|
|
|
|
|
|
t-Statistic
|
Prob.*
|
|
|
|
|
|
|
|
|
|
|
|
Augmented Dickey-Fuller test statistic
|
0.155618
|
0.7243
|
|
Test critical values:
|
1% level
|
|
-2.641672
|
|
|
5% level
|
|
-1.952066
|
|
|
10% level
|
|
-1.610400
|
|
|
|
|
|
|
|
|
|
|
|
|
*MacKinnon (1996) one-sided p-values.
|
|
|
|
|
|
|
|
|
|
|
|
|
Augmented Dickey-Fuller Test Equation
|
|
|
Dependent Variable: D(TCH)
|
|
|
|
Method: Least Squares
|
|
|
|
Date: 04/09/09 Time: 15:14
|
|
|
|
Sample (adjusted): 1977 2007
|
|
|
|
Included observations: 31 after adjustments
|
|
|
|
|
|
|
|
|
|
|
|
|
Variable
|
Coefficient
|
Std. Error
|
t-Statistic
|
Prob.
|
|
|
|
|
|
|
|
|
|
|
|
TCH(-1)
|
0.004219
|
0.027109
|
0.155618
|
0.8774
|
|
|
|
|
|
|
|
|
|
|
|
R-squared
|
-0.016609
|
Mean dependent var
|
8.612903
|
|
Adjusted R-squared
|
-0.016609
|
S.D. dependent var
|
66.31625
|
|
S.E. of regression
|
66.86472
|
Akaike info criterion
|
11.27495
|
|
Sum squared resid
|
134126.7
|
Schwarz criterion
|
11.32120
|
|
Log likelihood
|
-173.7617
|
Durbin-Watson stat
|
1.418090
|
|
|
|
|
|
|
|
|
|
|
TINT
|
Null Hypothesis: TINT has a unit root
|
|
|
Exogenous: Constant
|
|
|
|
Lag Length: 1 (Automatic based on SIC, MAXLAG=7)
|
|
|
|
|
|
|
|
|
|
|
|
|
|
t-Statistic
|
Prob.*
|
|
|
|
|
|
|
|
|
|
|
|
Augmented Dickey-Fuller test statistic
|
-2.374977
|
0.1569
|
|
Test critical values:
|
1% level
|
|
-3.670170
|
|
|
5% level
|
|
-2.963972
|
|
|
10% level
|
|
-2.621007
|
|
|
|
|
|
|
|
|
|
|
|
|
*MacKinnon (1996) one-sided p-values.
|
|
|
|
|
|
|
|
|
|
|
|
|
Augmented Dickey-Fuller Test Equation
|
|
|
Dependent Variable: D(TINT)
|
|
|
|
Method: Least Squares
|
|
|
|
Date: 04/09/09 Time: 15:16
|
|
|
|
Sample (adjusted): 1978 2007
|
|
|
|
Included observations: 30 after adjustments
|
|
|
|
|
|
|
|
|
|
|
|
|
Variable
|
Coefficient
|
Std. Error
|
t-Statistic
|
Prob.
|
|
|
|
|
|
|
|
|
|
|
|
TINT(-1)
|
-0.286281
|
0.120541
|
-2.374977
|
0.0249
|
|
D (TINT(-1))
|
0.109210
|
0.181535
|
0.601595
|
0.5525
|
|
C
|
4.162752
|
1.732221
|
2.403130
|
0.0234
|
|
|
|
|
|
|
|
|
|
|
|
R-squared
|
0.172829
|
Mean dependent var
|
0.066667
|
|
Adjusted R-squared
|
0.111557
|
S.D. dependent var
|
0.944433
|
|
S.E. of regression
|
0.890197
|
Akaike info criterion
|
2.699891
|
|
Sum squared resid
|
21.39615
|
Schwarz criterion
|
2.840011
|
|
Log likelihood
|
-37.49836
|
F-statistic
|
2.820691
|
|
Durbin-Watson stat
|
2.083219
|
Prob(F-statistic)
|
0.077185
|
|
|
|
|
|
|
|
|
|
|
INFL
|
Null Hypothesis: INFL has a unit root
|
|
|
Exogenous: None
|
|
|
|
Lag Length: 0 (Automatic based on SIC, MAXLAG=7)
|
|
|
|
|
|
|
|
|
|
|
|
|
|
t-Statistic
|
Prob.*
|
|
|
|
|
|
|
|
|
|
|
|
Augmented Dickey-Fuller test statistic
|
-2.794286
|
0.0068
|
|
Test critical values:
|
1% level
|
|
-2.641672
|
|
|
5% level
|
|
-1.952066
|
|
|
10% level
|
|
-1.610400
|
|
|
|
|
|
|
|
|
|
|
|
|
*MacKinnon (1996) one-sided p-values.
|
|
|
|
|
|
|
|
|
|
|
|
|
Augmented Dickey-Fuller Test Equation
|
|
|
Dependent Variable: D(INFL)
|
|
|
|
Method: Least Squares
|
|
|
|
Date: 04/09/09 Time: 15:18
|
|
|
|
Sample (adjusted): 1977 2007
|
|
|
|
Included observations: 31 after adjustments
|
|
|
|
|
|
|
|
|
|
|
|
|
Variable
|
Coefficient
|
Std. Error
|
t-Statistic
|
Prob.
|
|
|
|
|
|
|
|
|
|
|
|
INFL(-1)
|
-0.381760
|
0.136622
|
-2.794286
|
0.0090
|
|
|
|
|
|
|
|
|
|
|
|
R-squared
|
0.205096
|
Mean dependent var
|
-0.003516
|
|
Adjusted R-squared
|
0.205096
|
S.D. dependent var
|
0.084424
|
|
S.E. of regression
|
0.075270
|
Akaike info criterion
|
-2.303740
|
|
Sum squared resid
|
0.169968
|
Schwarz criterion
|
-2.257482
|
|
Log likelihood
|
36.70797
|
Durbin-Watson stat
|
2.120462
|
|
|
|
|
|
|
|
|
|
|
Annexe 2
EN DIFFERENCE PREMIERE
LPIB
|
Null Hypothesis: D(LPIB) has a unit root
|
|
|
Exogenous: Constant
|
|
|
|
Lag Length: 0 (Automatic based on SIC, MAXLAG=7)
|
|
|
|
|
|
|
|
|
|
|
|
|
|
t-Statistic
|
Prob.*
|
|
|
|
|
|
|
|
|
|
|
|
Augmented Dickey-Fuller test statistic
|
-6.611081
|
0.0000
|
|
Test critical values:
|
1% level
|
|
-3.670170
|
|
|
5% level
|
|
-2.963972
|
|
|
10% level
|
|
-2.621007
|
|
|
|
|
|
|
|
|
|
|
|
|
*MacKinnon (1996) one-sided p-values.
|
|
|
|
|
|
|
|
|
|
|
|
|
Augmented Dickey-Fuller Test Equation
|
|
|
Dependent Variable: D(LPIB,2)
|
|
|
Method: Least Squares
|
|
|
|
Date: 04/08/09 Time: 14:57
|
|
|
|
Sample (adjusted): 1978 2007
|
|
|
|
Included observations: 30 after adjustments
|
|
|
|
|
|
|
|
|
|
|
|
|
Variable
|
Coefficient
|
Std. Error
|
t-Statistic
|
Prob.
|
|
|
|
|
|
|
|
|
|
|
|
D(LPIB(-1))
|
-1.221358
|
0.184744
|
-6.611081
|
0.0000
|
|
C
|
0.045748
|
0.010995
|
4.160862
|
0.0003
|
|
|
|
|
|
|
|
|
|
|
|
R-squared
|
0.609519
|
Mean dependent var
|
-0.001033
|
|
Adjusted R-squared
|
0.595573
|
S.D. dependent var
|
0.072476
|
|
S.E. of regression
|
0.046091
|
Akaike info criterion
|
-3.252054
|
|
Sum squared resid
|
0.059483
|
Schwarz criterion
|
-3.158641
|
|
Log likelihood
|
50.78081
|
F-statistic
|
43.70639
|
|
Durbin-Watson stat
|
2.073384
|
Prob(F-statistic)
|
0.000000
|
|
|
|
|
|
|
|
|
|
|
LIT
|
Null Hypothesis: D(LIT) has a unit root
|
|
|
Exogenous: None
|
|
|
|
Lag Length: 0 (Automatic based on SIC, MAXLAG=7)
|
|
|
|
|
|
|
|
|
|
|
|
|
|
t-Statistic
|
Prob.*
|
|
|
|
|
|
|
|
|
|
|
|
Augmented Dickey-Fuller test statistic
|
-3.409245
|
0.0013
|
|
Test critical values:
|
1% level
|
|
-2.644302
|
|
|
5% level
|
|
-1.952473
|
|
|
10% level
|
|
-1.610211
|
|
|
|
|
|
|
|
|
|
|
|
|
*MacKinnon (1996) one-sided p-values.
|
|
|
|
|
|
|
|
|
|
|
|
|
Augmented Dickey-Fuller Test Equation
|
|
|
Dependent Variable: D(LIT,2)
|
|
|
|
Method: Least Squares
|
|
|
|
Date: 04/08/09 Time: 14:59
|
|
|
|
Sample (adjusted): 1978 2007
|
|
|
|
Included observations: 30 after adjustments
|
|
|
|
|
|
|
|
|
|
|
|
|
Variable
|
Coefficient
|
Std. Error
|
t-Statistic
|
Prob.
|
|
|
|
|
|
|
|
|
|
|
|
D(LIT(-1))
|
-0.575272
|
0.168739
|
-3.409245
|
0.0019
|
|
|
|
|
|
|
|
|
|
|
|
R-squared
|
0.286037
|
Mean dependent var
|
0.002083
|
|
Adjusted R-squared
|
0.286037
|
S.D. dependent var
|
0.198978
|
|
S.E. of regression
|
0.168129
|
Akaike info criterion
|
-0.695400
|
|
Sum squared resid
|
0.819758
|
Schwarz criterion
|
-0.648693
|
|
Log likelihood
|
11.43100
|
Durbin-Watson stat
|
2.012184
|
|
|
|
|
|
|
|
|
|
|
LDET
|
Null Hypothesis: D(LDET) has a unit root
|
|
|
Exogenous: None
|
|
|
|
Lag Length: 0 (Automatic based on SIC, MAXLAG=7)
|
|
|
|
|
|
|
|
|
|
|
|
|
|
t-Statistic
|
Prob.*
|
|
|
|
|
|
|
|
|
|
|
|
Augmented Dickey-Fuller test statistic
|
-2.419530
|
0.0173
|
|
Test critical values:
|
1% level
|
|
-2.644302
|
|
|
5% level
|
|
-1.952473
|
|
|
10% level
|
|
-1.610211
|
|
|
|
|
|
|
|
|
|
|
|
|
*MacKinnon (1996) one-sided p-values.
|
|
|
|
|
|
|
|
|
|
|
|
|
Augmented Dickey-Fuller Test Equation
|
|
|
Dependent Variable: D(LDET,2)
|
|
|
Method: Least Squares
|
|
|
|
Date: 04/08/09 Time: 15:05
|
|
|
|
Sample (adjusted): 1978 2007
|
|
|
|
Included observations: 30 after adjustments
|
|
|
|
|
|
|
|
|
|
|
|
|
Variable
|
Coefficient
|
Std. Error
|
t-Statistic
|
Prob.
|
|
|
|
|
|
|
|
|
|
|
|
D(LDET(-1))
|
-0.397249
|
0.164185
|
-2.419530
|
0.0220
|
|
|
|
|
|
|
|
|
|
|
|
R-squared
|
0.160168
|
Mean dependent var
|
-0.023607
|
|
Adjusted R-squared
|
0.160168
|
S.D. dependent var
|
0.248100
|
|
S.E. of regression
|
0.227364
|
Akaike info criterion
|
-0.091760
|
|
Sum squared resid
|
1.499142
|
Schwarz criterion
|
-0.045054
|
|
Log likelihood
|
2.376407
|
Durbin-Watson stat
|
2.082491
|
|
|
|
|
|
|
|
|
|
|
TO
|
Null Hypothesis: D(TO) has a unit root
|
|
|
Exogenous: None
|
|
|
|
Lag Length: 1 (Automatic based on SIC, MAXLAG=6)
|
|
|
|
|
|
|
|
|
|
|
|
|
|
t-Statistic
|
Prob.*
|
|
|
|
|
|
|
|
|
|
|
|
Augmented Dickey-Fuller test statistic
|
-4.915889
|
0.0000
|
|
Test critical values:
|
1% level
|
|
-2.647120
|
|
|
5% level
|
|
-1.952910
|
|
|
10% level
|
|
-1.610011
|
|
|
|
|
|
|
|
|
|
|
|
|
*MacKinnon (1996) one-sided p-values.
|
|
|
|
|
|
|
|
|
|
|
|
|
Augmented Dickey-Fuller Test Equation
|
|
|
Dependent Variable: D(TO,2)
|
|
|
|
Method: Least Squares
|
|
|
|
Date: 04/08/09 Time: 15:18
|
|
|
|
Sample (adjusted): 1979 2007
|
|
|
|
Included observations: 29 after adjustments
|
|
|
|
|
|
|
|
|
|
|
|
|
Variable
|
Coefficient
|
Std. Error
|
t-Statistic
|
Prob.
|
|
|
|
|
|
|
|
|
|
|
|
D(TO(-1))
|
-1.138279
|
0.231551
|
-4.915889
|
0.0000
|
|
D(TO(-1),2)
|
0.365011
|
0.180254
|
2.024986
|
0.0529
|
|
|
|
|
|
|
|
|
|
|
|
R-squared
|
0.491749
|
Mean dependent var
|
0.103448
|
|
Adjusted R-squared
|
0.472925
|
S.D. dependent var
|
13.95233
|
|
S.E. of regression
|
10.12938
|
Akaike info criterion
|
7.535230
|
|
Sum squared resid
|
2770.318
|
Schwarz criterion
|
7.629526
|
|
Log likelihood
|
-107.2608
|
Durbin-Watson stat
|
1.982293
|
|
|
|
|
|
|
|
|
|
|
TSS
|
Null Hypothesis: D(TSS) has a unit root
|
|
|
Exogenous: Constant, Linear Trend
|
|
|
Lag Length: 0 (Automatic based on SIC, MAXLAG=7)
|
|
|
|
|
|
|
|
|
|
|
|
|
|
t-Statistic
|
Prob.*
|
|
|
|
|
|
|
|
|
|
|
|
Augmented Dickey-Fuller test statistic
|
-5.949888
|
0.0002
|
|
Test critical values:
|
1% level
|
|
-4.296729
|
|
|
5% level
|
|
-3.568379
|
|
|
10% level
|
|
-3.218382
|
|
|
|
|
|
|
|
|
|
|
|
|
*MacKinnon (1996) one-sided p-values.
|
|
|
|
|
|
|
|
|
|
|
|
|
Augmented Dickey-Fuller Test Equation
|
|
|
Dependent Variable: D(TSS,2)
|
|
|
|
Method: Least Squares
|
|
|
|
Date: 04/09/09 Time: 14:21
|
|
|
|
Sample (adjusted): 1978 2007
|
|
|
|
Included observations: 30 after adjustments
|
|
|
|
|
|
|
|
|
|
|
|
|
Variable
|
Coefficient
|
Std. Error
|
t-Statistic
|
Prob.
|
|
|
|
|
|
|
|
|
|
|
|
D(TSS(-1))
|
-1.135500
|
0.190844
|
-5.949888
|
0.0000
|
|
C
|
-1.556729
|
1.314297
|
-1.184458
|
0.2466
|
|
@TREND(1976)
|
0.150601
|
0.072940
|
2.064730
|
0.0487
|
|
|
|
|
|
|
|
|
|
|
|
R-squared
|
0.567706
|
Mean dependent var
|
0.133333
|
|
Adjusted R-squared
|
0.535684
|
S.D. dependent var
|
4.826174
|
|
S.E. of regression
|
3.288590
|
Akaike info criterion
|
5.313434
|
|
Sum squared resid
|
292.0002
|
Schwarz criterion
|
5.453554
|
|
Log likelihood
|
-76.70151
|
F-statistic
|
17.72875
|
|
Durbin-Watson stat
|
1.980384
|
Prob(F-statistic)
|
0.000012
|
|
|
|
|
|
|
|
|
|
|
LAID
|
Null Hypothesis: D(LAID) has a unit root
|
|
|
Exogenous: None
|
|
|
|
Lag Length: 0 (Automatic based on SIC, MAXLAG=7)
|
|
|
|
|
|
|
|
|
|
|
|
|
|
t-Statistic
|
Prob.*
|
|
|
|
|
|
|
|
|
|
|
|
Augmented Dickey-Fuller test statistic
|
-6.377048
|
0.0000
|
|
Test critical values:
|
1% level
|
|
-2.644302
|
|
|
5% level
|
|
-1.952473
|
|
|
10% level
|
|
-1.610211
|
|
|
|
|
|
|
|
|
|
|
|
|
*MacKinnon (1996) one-sided p-values.
|
|
|
|
|
|
|
|
|
|
|
|
|
Augmented Dickey-Fuller Test Equation
|
|
|
Dependent Variable: D(LAID,2)
|
|
|
Method: Least Squares
|
|
|
|
Date: 04/08/09 Time: 15:09
|
|
|
|
Sample (adjusted): 1978 2007
|
|
|
|
Included observations: 30 after adjustments
|
|
|
|
|
|
|
|
|
|
|
|
|
Variable
|
Coefficient
|
Std. Error
|
t-Statistic
|
Prob.
|
|
|
|
|
|
|
|
|
|
|
|
D(LAID(-1))
|
-1.346548
|
0.211155
|
-6.377048
|
0.0000
|
|
|
|
|
|
|
|
|
|
|
|
R-squared
|
0.581770
|
Mean dependent var
|
0.029404
|
|
Adjusted R-squared
|
0.581770
|
S.D. dependent var
|
0.435551
|
|
S.E. of regression
|
0.281674
|
Akaike info criterion
|
0.336632
|
|
Sum squared resid
|
2.300865
|
Schwarz criterion
|
0.383338
|
|
Log likelihood
|
-4.049475
|
Durbin-Watson stat
|
1.795691
|
|
|
|
|
|
|
|
|
|
|
SDEXP
|
Null Hypothesis: D(SDEXP) has a unit root
|
|
|
Exogenous: Constant, Linear Trend
|
|
|
Lag Length: 5 (Automatic based on SIC, MAXLAG=7)
|
|
|
|
|
|
|
|
|
|
|
|
|
|
t-Statistic
|
Prob.*
|
|
|
|
|
|
|
|
|
|
|
|
Augmented Dickey-Fuller test statistic
|
-7.932493
|
0.0000
|
|
Test critical values:
|
1% level
|
|
-4.374307
|
|
|
5% level
|
|
-3.603202
|
|
|
10% level
|
|
-3.238054
|
|
|
|
|
|
|
|
|
|
|
|
|
*MacKinnon (1996) one-sided p-values.
|
|
|
|
|
|
|
|
|
|
|
|
|
Augmented Dickey-Fuller Test Equation
|
|
|
Dependent Variable: D(SDEXP,2)
|
|
|
Method: Least Squares
|
|
|
|
Date: 04/08/09 Time: 15:13
|
|
|
|
Sample (adjusted): 1983 2007
|
|
|
|
Included observations: 25 after adjustments
|
|
|
|
|
|
|
|
|
|
|
|
|
Variable
|
Coefficient
|
Std. Error
|
t-Statistic
|
Prob.
|
|
|
|
|
|
|
|
|
|
|
|
D(SDEXP(-1))
|
-2.939992
|
0.370627
|
-7.932493
|
0.0000
|
|
D(SDEXP(-1),2)
|
1.532661
|
0.255262
|
6.004257
|
0.0000
|
|
D(SDEXP(-2),2)
|
1.139831
|
0.224538
|
5.076330
|
0.0001
|
|
D(SDEXP(-3),2)
|
0.728294
|
0.166048
|
4.386041
|
0.0004
|
|
D(SDEXP(-4),2)
|
0.365273
|
0.118685
|
3.077658
|
0.0068
|
|
D(SDEXP(-5),2)
|
0.210441
|
0.065765
|
3.199900
|
0.0052
|
|
C
|
-12.09656
|
2.916189
|
-4.148071
|
0.0007
|
|
@TREND(1976)
|
0.422857
|
0.134425
|
3.145679
|
0.0059
|
|
|
|
|
|
|
|
|
|
|
|
R-squared
|
0.892309
|
Mean dependent var
|
-0.212618
|
|
Adjusted R-squared
|
0.847966
|
S.D. dependent var
|
10.69540
|
|
S.E. of regression
|
4.170306
|
Akaike info criterion
|
5.948193
|
|
Sum squared resid
|
295.6547
|
Schwarz criterion
|
6.338234
|
|
Log likelihood
|
-66.35242
|
F-statistic
|
20.12273
|
|
Durbin-Watson stat
|
2.560159
|
Prob(F-statistic)
|
0.000000
|
|
|
|
|
|
|
|
|
|
|
TCH
|
Null Hypothesis: D(TCH) has a unit root
|
|
|
Exogenous: None
|
|
|
|
Lag Length: 0 (Automatic based on SIC, MAXLAG=7)
|
|
|
|
|
|
|
|
|
|
|
|
|
|
t-Statistic
|
Prob.*
|
|
|
|
|
|
|
|
|
|
|
|
Augmented Dickey-Fuller test statistic
|
-3.978331
|
0.0003
|
|
Test critical values:
|
1% level
|
|
-2.644302
|
|
|
5% level
|
|
-1.952473
|
|
|
10% level
|
|
-1.610211
|
|
|
|
|
|
|
|
|
|
|
|
|
*MacKinnon (1996) one-sided p-values.
|
|
|
|
|
|
|
|
|
|
|
|
|
Augmented Dickey-Fuller Test Equation
|
|
|
Dependent Variable: D(TCH,2)
|
|
|
|
Method: Least Squares
|
|
|
|
Date: 04/09/09 Time: 15:15
|
|
|
|
Sample (adjusted): 1978 2007
|
|
|
|
Included observations: 30 after adjustments
|
|
|
|
|
|
|
|
|
|
|
|
|
Variable
|
Coefficient
|
Std. Error
|
t-Statistic
|
Prob.
|
|
|
|
|
|
|
|
|
|
|
|
D(TCH(-1))
|
-0.710284
|
0.178538
|
-3.978331
|
0.0004
|
|
|
|
|
|
|
|
|
|
|
|
R-squared
|
0.352589
|
Mean dependent var
|
-2.166667
|
|
Adjusted R-squared
|
0.352589
|
S.D. dependent var
|
80.78626
|
|
S.E. of regression
|
65.00213
|
Akaike info criterion
|
11.21948
|
|
Sum squared resid
|
122533.0
|
Schwarz criterion
|
11.26619
|
|
Log likelihood
|
-167.2922
|
Durbin-Watson stat
|
1.892579
|
|
|
|
|
|
|
|
|
|
|
TINT
|
Null Hypothesis: D(TINT) has a unit root
|
|
|
Exogenous: None
|
|
|
|
Lag Length: 0 (Automatic based on SIC, MAXLAG=7)
|
|
|
|
|
|
|
|
|
|
|
|
|
|
t-Statistic
|
Prob.*
|
|
|
|
|
|
|
|
|
|
|
|
Augmented Dickey-Fuller test statistic
|
-5.385165
|
0.0000
|
|
Test critical values:
|
1% level
|
|
-2.644302
|
|
|
5% level
|
|
-1.952473
|
|
|
10% level
|
|
-1.610211
|
|
|
|
|
|
|
|
|
|
|
|
|
*MacKinnon (1996) one-sided p-values.
|
|
|
|
|
|
|
|
|
|
|
|
|
Augmented Dickey-Fuller Test Equation
|
|
|
Dependent Variable: D(TINT,2)
|
|
|
Method: Least Squares
|
|
|
|
Date: 04/09/09 Time: 15:17
|
|
|
|
Sample (adjusted): 1978 2007
|
|
|
|
Included observations: 30 after adjustments
|
|
|
|
|
|
|
|
|
|
|
|
|
Variable
|
Coefficient
|
Std. Error
|
t-Statistic
|
Prob.
|
|
|
|
|
|
|
|
|
|
|
|
D(TINT(-1))
|
-1.000000
|
0.185695
|
-5.385165
|
0.0000
|
|
|
|
|
|
|
|
|
|
|
|
R-squared
|
0.500000
|
Mean dependent var
|
0.000000
|
|
Adjusted R-squared
|
0.500000
|
S.D. dependent var
|
1.339068
|
|
S.E. of regression
|
0.946864
|
Akaike info criterion
|
2.761443
|
|
Sum squared resid
|
26.00000
|
Schwarz criterion
|
2.808149
|
|
Log likelihood
|
-40.42164
|
Durbin-Watson stat
|
2.000000
|
|
|
|
|
|
|
|
|
|
|
Annexe 3
MODELE 1
TEST DE ENGLE ET GRANGER
· ESTIMATION DU MODELE DE LONG TERME
Dependent Variable: IDH
|
|
|
Method: Least Squares
|
|
|
Date: 04/09/09 Time: 14:40
|
|
|
Sample: 1976 2007
|
|
|
Included observations: 32
|
|
|
|
|
|
|
|
|
|
|
|
|
Variable
|
Coefficient
|
Std. Error
|
t-Statistic
|
Prob.
|
|
|
|
|
|
|
|
|
|
|
C
|
-216.7251
|
46.52520
|
-4.658229
|
0.0001
|
LPIB
|
7.997624
|
2.468444
|
3.239945
|
0.0035
|
LIT
|
2.457331
|
0.730079
|
3.365842
|
0.0026
|
LDET
|
-0.207087
|
0.498113
|
-0.415742
|
0.6813
|
TO
|
0.053418
|
0.020577
|
2.596064
|
0.0158
|
TSS
|
-0.116604
|
0.071859
|
-1.622689
|
0.1177
|
LAID
|
1.185568
|
0.869470
|
1.363552
|
0.1854
|
SDEXP
|
0.006648
|
0.020750
|
0.320399
|
0.7514
|
|
|
|
|
|
|
|
|
|
|
R-squared
|
0.940122
|
Mean dependent var
|
38.34375
|
Adjusted R-squared
|
0.922657
|
S.D. dependent var
|
4.162888
|
S.E. of regression
|
1.157723
|
Akaike info criterion
|
3.343106
|
Sum squared resid
|
32.16776
|
Schwarz criterion
|
3.709540
|
Log likelihood
|
-45.48969
|
F-statistic
|
53.83041
|
Durbin-Watson stat
|
1.892769
|
Prob(F-statistic)
|
0.000000
|
|
|
|
|
|
|
|
|
|
|
|
· TEST DE STATIONNARITE SUR LE RESIDU DU MODELE DE
LONG TERME
|
Null Hypothesis: RES has a unit root
|
|
|
Exogenous: None
|
|
|
|
Lag Length: 0 (Automatic based on SIC, MAXLAG=7)
|
|
|
|
|
|
|
|
|
|
|
|
|
|
t-Statistic
|
Prob.*
|
|
|
|
|
|
|
|
|
|
|
|
Augmented Dickey-Fuller test statistic
|
-5.343584
|
0.0000
|
|
Test critical values:
|
1% level
|
|
-2.641672
|
|
|
5% level
|
|
-1.952066
|
|
|
10% level
|
|
-1.610400
|
|
|
|
|
|
|
|
|
|
|
|
|
*MacKinnon (1996) one-sided p-values.
|
|
|
|
|
|
|
|
|
|
|
|
|
Augmented Dickey-Fuller Test Equation
|
|
|
Dependent Variable: D(RES)
|
|
|
|
Method: Least Squares
|
|
|
|
Date: 04/09/09 Time: 14:38
|
|
|
|
Sample (adjusted): 1977 2007
|
|
|
|
Included observations: 31 after adjustments
|
|
|
|
|
|
|
|
|
|
|
|
|
Variable
|
Coefficient
|
Std. Error
|
t-Statistic
|
Prob.
|
|
|
|
|
|
|
|
|
|
|
|
RES(-1)
|
-0.961948
|
0.180019
|
-5.343584
|
0.0000
|
|
|
|
|
|
|
|
|
|
|
|
R-squared
|
0.487223
|
Mean dependent var
|
4.032258
|
|
Adjusted R-squared
|
0.487223
|
S.D. dependent var
|
141.7438
|
|
S.E. of regression
|
101.5005
|
Akaike info criterion
|
12.10973
|
|
Sum squared resid
|
309070.7
|
Schwarz criterion
|
12.15599
|
|
Log likelihood
|
-186.7008
|
Durbin-Watson stat
|
2.005548
|
|
|
|
|
|
|
|
|
|
|
TEST DE COINTEGRATION DE JOHENSEN
|
Date: 04/09/09 Time: 14:25
|
|
|
|
Sample (adjusted): 1978 2007
|
|
|
|
Included observations: 30 after adjustments
|
|
|
Trend assumption: No deterministic trend
|
|
|
Series: IDH LPIB LIT LDET TSS LAID SDEXP
|
|
|
Lags interval (in first differences): 1 to 1
|
|
|
|
|
|
|
|
|
|
|
|
|
Unrestricted Cointegration Rank Test (Maximum Eigenvalue)
|
|
|
|
|
|
|
|
|
|
|
|
Hypothesized
|
|
Max-Eigen
|
0.05
|
|
|
No. of CE(s)
|
Eigenvalue
|
Statistic
|
Critical Value
|
Prob.**
|
|
|
|
|
|
|
|
|
|
|
|
None *
|
0.892044
|
66.78091
|
42.77219
|
0.0000
|
|
At most 1
|
0.682772
|
34.44400
|
36.63019
|
0.0880
|
|
At most 2
|
0.556570
|
24.39643
|
30.43961
|
0.2345
|
|
At most 3
|
0.393569
|
15.00493
|
24.15921
|
0.5083
|
|
At most 4
|
0.314125
|
11.31181
|
17.79730
|
0.3572
|
|
At most 5
|
0.260448
|
9.051301
|
11.22480
|
0.1177
|
|
At most 6
|
0.031644
|
0.964651
|
4.129906
|
0.3779
|
|
|
|
|
|
|
|
|
|
|
|
Max-eigenvalue test indicates 1 cointegrating eqn(s) at the
0.05 level
|
|
* denotes rejection of the hypothesis at the 0.05 level
|
|
**MacKinnon-Haug-Michelis (1999) p-values
|
|
ESTIMATION DU MODELE DE COURT TERME (MODELE
DYNAMIQUE)
|
Dependent Variable: D(IDH)
|
|
|
|
Method: Least Squares
|
|
|
|
Date: 04/09/09 Time: 14:43
|
|
|
|
Sample (adjusted): 1977 2007
|
|
|
|
Included observations: 31 after adjustments
|
|
|
|
|
|
|
|
|
|
|
|
|
Variable
|
Coefficient
|
Std. Error
|
t-Statistic
|
Prob.
|
|
|
|
|
|
|
|
|
|
|
|
C
|
0.187125
|
0.278990
|
0.670723
|
0.5094
|
|
D(LPIB)
|
4.924067
|
4.910475
|
1.002768
|
0.3269
|
|
D(LIT)
|
2.858551
|
1.623670
|
1.760549
|
0.0922
|
|
D(LDET)
|
-0.411194
|
0.877806
|
-0.468434
|
0.6441
|
|
D(TO)
|
0.051519
|
0.022055
|
2.335985
|
0.0290
|
|
D(TSS)
|
-0.127330
|
0.078275
|
-1.626704
|
0.1180
|
|
D(LAID)
|
0.223012
|
0.765122
|
0.291472
|
0.7734
|
|
D(SDEXP)
|
0.011868
|
0.015257
|
0.777878
|
0.4449
|
|
RES(-1)
|
-0.009396
|
0.002409
|
-3.901220
|
0.0008
|
|
|
|
|
|
|
|
|
|
|
|
R-squared
|
0.510669
|
Mean dependent var
|
0.451613
|
|
Adjusted R-squared
|
0.332730
|
S.D. dependent var
|
1.386572
|
|
S.E. of regression
|
1.132643
|
Akaike info criterion
|
3.324685
|
|
Sum squared resid
|
28.22335
|
Schwarz criterion
|
3.741004
|
|
Log likelihood
|
-42.53261
|
F-statistic
|
2.869917
|
|
Durbin-Watson stat
|
1.941260
|
Prob(F-statistic)
|
0.023847
|
|
|
|
|
|
|
|
|
|
|
TESTS CLASSIQUES SUR LE MODELE A CORRECTION
D'ERREUR
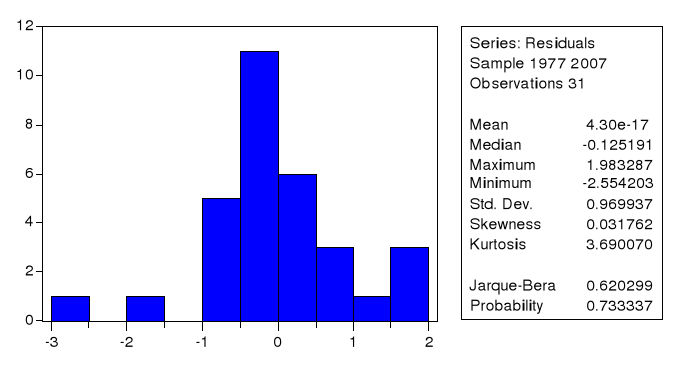
TEST DE NORMALITE DE JARQUE BERA
TEST STABILITE DU MODELE
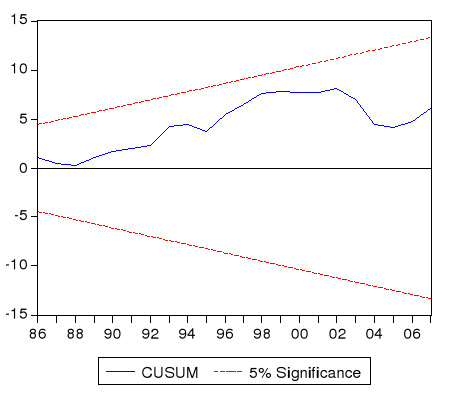
· TEST DE CUSUM
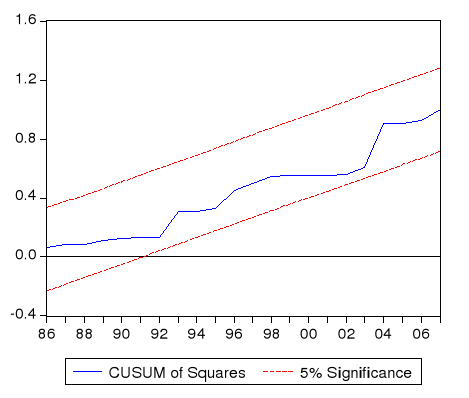
· CUSUM CARRE
TEST D'HOMOROSEDASTICITE DES ERREURS (WHITE)
White Heteroskedasticity Test:
|
|
|
|
|
|
|
|
|
|
|
|
F-statistic
|
0.698979
|
Probability
|
0.755859
|
Obs*R-squared
|
13.76661
|
Probability
|
0.616096
|
|
|
|
|
|
|
|
|
|
|
|
|
|
|
|
Test Equation:
|
|
|
Dependent Variable: RESID^2
|
|
|
Method: Least Squares
|
|
|
Date: 04/09/09 Time: 14:50
|
|
|
Sample: 1977 2007
|
|
|
Included observations: 31
|
|
|
|
|
|
|
|
|
|
|
|
|
Variable
|
Coefficient
|
Std. Error
|
t-Statistic
|
Prob.
|
|
|
|
|
|
|
|
|
|
|
C
|
1.215681
|
0.589486
|
2.062274
|
0.0583
|
D(LPIB)
|
2.397821
|
11.27618
|
0.212645
|
0.8347
|
(D(LPIB))^2
|
-47.44930
|
80.63412
|
-0.588452
|
0.5656
|
D(LIT)
|
2.328734
|
2.643433
|
0.880951
|
0.3932
|
(D(LIT))^2
|
-2.509237
|
6.162528
|
-0.407177
|
0.6900
|
D(LDET)
|
-2.177188
|
2.771256
|
-0.785632
|
0.4452
|
(D(LDET))^2
|
-0.321448
|
5.159193
|
-0.062306
|
0.9512
|
D(TO)
|
-0.009254
|
0.039178
|
-0.236196
|
0.8167
|
(D(TO))^2
|
0.002153
|
0.002278
|
0.945450
|
0.3605
|
D(TSS)
|
-0.111500
|
0.149426
|
-0.746187
|
0.4679
|
(D(TSS))^2
|
-0.031908
|
0.020907
|
-1.526161
|
0.1492
|
D(LAID)
|
1.095520
|
1.630896
|
0.671729
|
0.5127
|
(D(LAID))^2
|
-2.201832
|
5.180920
|
-0.424989
|
0.6773
|
D(SDEXP)
|
0.014970
|
0.026812
|
0.558316
|
0.5854
|
(D(SDEXP))^2
|
-0.000367
|
0.000896
|
-0.409816
|
0.6881
|
RES(-1)
|
-0.007924
|
0.004571
|
-1.733552
|
0.1050
|
RES(-1)^2
|
3.63E-05
|
3.14E-05
|
1.154643
|
0.2676
|
|
|
|
|
|
|
|
|
|
|
R-squared
|
0.444084
|
Mean dependent var
|
0.910431
|
Adjusted R-squared
|
-0.191248
|
S.D. dependent var
|
1.517920
|
S.E. of regression
|
1.656724
|
Akaike info criterion
|
4.149405
|
Sum squared resid
|
38.42626
|
Schwarz criterion
|
4.935785
|
Log likelihood
|
-47.31578
|
F-statistic
|
0.698979
|
Durbin-Watson stat
|
1.968442
|
Prob(F-statistic)
|
0.755859
|
|
|
|
|
|
|
|
|
|
|
|
TEST DE CORRELATION DES ERREURS
Breusch-Godfrey Serial Correlation LM Test:
|
|
|
|
|
|
|
|
|
|
|
|
F-statistic
|
0.462052
|
Probability
|
0.636548
|
Obs*R-squared
|
1.369100
|
Probability
|
0.504317
|
|
|
|
|
|
|
|
|
|
|
|
|
|
|
|
Test Equation:
|
|
|
Dependent Variable: RESID
|
|
|
Method: Least Squares
|
|
|
Date: 04/09/09 Time: 14:53
|
|
|
Presample missing value lagged residuals set to zero.
|
|
|
|
|
|
|
|
|
|
|
Variable
|
Coefficient
|
Std. Error
|
t-Statistic
|
Prob.
|
|
|
|
|
|
|
|
|
|
|
C
|
-0.040084
|
0.289260
|
-0.138573
|
0.8912
|
D(LPIB)
|
0.305526
|
5.064585
|
0.060326
|
0.9525
|
D(LIT)
|
0.374214
|
1.712375
|
0.218535
|
0.8292
|
D(LDET)
|
0.225210
|
0.955161
|
0.235782
|
0.8160
|
D(TO)
|
0.004353
|
0.024503
|
0.177634
|
0.8608
|
D(TSS)
|
-0.036277
|
0.092022
|
-0.394227
|
0.6976
|
D(LAID)
|
-0.024859
|
0.910796
|
-0.027294
|
0.9785
|
D(SDEXP)
|
-0.004856
|
0.016493
|
-0.294447
|
0.7715
|
RES(-1)
|
0.001774
|
0.008058
|
0.220191
|
0.8280
|
RESID(-1)
|
-0.233771
|
0.897558
|
-0.260452
|
0.7972
|
RESID(-2)
|
-0.257362
|
0.269420
|
-0.955247
|
0.3509
|
|
|
|
|
|
|
|
|
|
|
R-squared
|
0.044165
|
Mean dependent var
|
4.30E-17
|
Adjusted R-squared
|
-0.433753
|
S.D. dependent var
|
0.969937
|
S.E. of regression
|
1.161397
|
Akaike info criterion
|
3.408548
|
Sum squared resid
|
26.97688
|
Schwarz criterion
|
3.917382
|
Log likelihood
|
-41.83249
|
F-statistic
|
0.092410
|
Durbin-Watson stat
|
1.900450
|
Prob(F-statistic)
|
0.999760
|
|
|
|
|
|
|
|
|
|
|
|
Annexe 4
MODELE 2
ESTIMATION DU MELE DE LONG TERME
Dependent Variable: LIT
|
|
|
Method: Least Squares
|
|
|
Date: 04/09/09 Time: 15:30
|
|
|
Sample: 1976 2007
|
|
|
Included observations: 32
|
|
|
|
|
|
|
|
|
|
|
|
|
Variable
|
Coefficient
|
Std. Error
|
t-Statistic
|
Prob.
|
|
|
|
|
|
|
|
|
|
|
C
|
-38.46581
|
6.602097
|
-5.826302
|
0.0000
|
LPIB
|
1.924118
|
0.285040
|
6.750344
|
0.0000
|
TINT
|
-0.110552
|
0.058142
|
-1.901410
|
0.0684
|
LDET
|
-0.296322
|
0.141263
|
-2.097662
|
0.0458
|
INFL
|
3.495036
|
0.706264
|
4.948623
|
0.0000
|
TCH
|
0.001726
|
0.000742
|
2.325249
|
0.0281
|
|
|
|
|
|
|
|
|
|
|
R-squared
|
0.865328
|
Mean dependent var
|
5.094267
|
Adjusted R-squared
|
0.839429
|
S.D. dependent var
|
0.669844
|
S.E. of regression
|
0.268415
|
Akaike info criterion
|
0.374797
|
Sum squared resid
|
1.873215
|
Schwarz criterion
|
0.649623
|
Log likelihood
|
0.003246
|
F-statistic
|
33.41226
|
Durbin-Watson stat
|
0.809948
|
Prob(F-statistic)
|
0.000000
|
|
|
|
|
|
|
|
|
|
|
|
TEST DE STATIONNARITE SUR LE RESIDU DU MODELE DE LONG
TERME
Null Hypothesis: RES2 has a unit root
|
|
Exogenous: None
|
|
|
Lag Length: 0 (Automatic based on SIC, MAXLAG=7)
|
|
|
|
|
|
|
|
|
|
|
|
|
|
t-Statistic
|
Prob.*
|
|
|
|
|
|
|
|
|
|
|
Augmented Dickey-Fuller test statistic
|
-2.809569
|
0.0065
|
Test critical values:
|
1% level
|
|
-2.641672
|
|
|
5% level
|
|
-1.952066
|
|
|
10% level
|
|
-1.610400
|
|
|
|
|
|
|
|
|
|
|
|
*MacKinnon (1996) one-sided p-values.
|
|
|
|
|
|
|
|
|
|
|
|
Augmented Dickey-Fuller Test Equation
|
|
Dependent Variable: D(RES2)
|
|
|
Method: Least Squares
|
|
|
Date: 04/09/09 Time: 15:28
|
|
|
Sample (adjusted): 1977 2007
|
|
|
Included observations: 31 after adjustments
|
|
|
|
|
|
|
|
|
|
|
|
Variable
|
Coefficient
|
Std. Error
|
t-Statistic
|
Prob.
|
|
|
|
|
|
|
|
|
|
|
RES2(-1)
|
-0.412134
|
0.146689
|
-2.809569
|
0.0086
|
|
|
|
|
|
|
|
|
|
|
R-squared
|
0.207615
|
Mean dependent var
|
0.645161
|
Adjusted R-squared
|
0.207615
|
S.D. dependent var
|
22.11869
|
S.E. of regression
|
19.68917
|
Akaike info criterion
|
8.829741
|
Sum squared resid
|
11629.91
|
Schwarz criterion
|
8.875999
|
Log likelihood
|
-135.8610
|
Durbin-Watson stat
|
1.738554
|
|
|
|
|
|
|
|
|
|
|
|
TEST DE COINTEGRATION DE JOHENSEN
Date: 04/09/09 Time: 15:23
|
|
|
Sample (adjusted): 1978 2007
|
|
|
Included observations: 30 after adjustments
|
|
Trend assumption: No deterministic trend
|
|
Series: LIT LPIB TINT LDET TCH
|
|
|
Lags interval (in first differences): 1 to 1
|
|
|
|
|
|
|
Unrestricted Cointegration Rank Test (Trace)
|
|
|
|
|
|
|
|
|
|
|
|
Hypothesized
|
|
Trace
|
0.05
|
|
No. of CE(s)
|
Eigenvalue
|
Statistic
|
Critical Value
|
Prob.**
|
|
|
|
|
|
|
|
|
|
|
None *
|
0.621841
|
61.88650
|
60.06141
|
0.0348
|
At most 1
|
0.411944
|
32.71331
|
40.17493
|
0.2294
|
At most 2
|
0.341758
|
16.78531
|
24.27596
|
0.3253
|
At most 3
|
0.122758
|
4.239807
|
12.32090
|
0.6762
|
At most 4
|
0.010301
|
0.310622
|
4.129906
|
0.6391
|
|
|
|
|
|
|
|
|
|
|
Trace test indicates 1 cointegrating eqn(s) at the 0.05
level
|
* denotes rejection of the hypothesis at the 0.05
level
|
**MacKinnon-Haug-Michelis (1999) p-values
|
|
|
ESTIMATION DU MODELE A CORRECTION D'ERREUR
Dependent Variable: D(LIT)
|
|
|
Method: Least Squares
|
|
|
Date: 04/11/09 Time: 14:08
|
|
|
Sample (adjusted): 1977 2007
|
|
|
Included observations: 31 after adjustments
|
|
|
|
|
|
|
|
|
|
|
|
Variable
|
Coefficient
|
Std. Error
|
t-Statistic
|
Prob.
|
|
|
|
|
|
|
|
|
|
|
C
|
-0.066069
|
0.033897
|
-1.949128
|
0.0631
|
D(LPIB)
|
0.546308
|
0.510035
|
1.071119
|
0.2948
|
D(TINT)
|
-0.055251
|
0.027821
|
-1.985983
|
0.0586
|
D(LDET)
|
-0.154053
|
0.120102
|
-1.282688
|
0.2119
|
INFL
|
2.010796
|
0.419540
|
4.792857
|
0.0001
|
D(TCH)
|
-0.000421
|
0.000397
|
-1.061083
|
0.2992
|
RESS(-1)
|
-0.229498
|
0.094826
|
-2.420185
|
0.0234
|
|
|
|
|
|
|
|
|
|
|
R-squared
|
0.598782
|
Mean dependent var
|
0.050366
|
Adjusted R-squared
|
0.498477
|
S.D. dependent var
|
0.175168
|
S.E. of regression
|
0.124051
|
Akaike info criterion
|
-1.140574
|
Sum squared resid
|
0.369325
|
Schwarz criterion
|
-0.816771
|
Log likelihood
|
24.67890
|
F-statistic
|
5.969633
|
Durbin-Watson stat
|
1.552018
|
Prob(F-statistic)
|
0.000629
|
|
|
|
|
|
|
|
|
|
|
|
TESTS CLASSIQUES SUR LE MODELE A CORRECTION
D'ERREUR
TEST DE NORMALITE DE JARQUE BERA
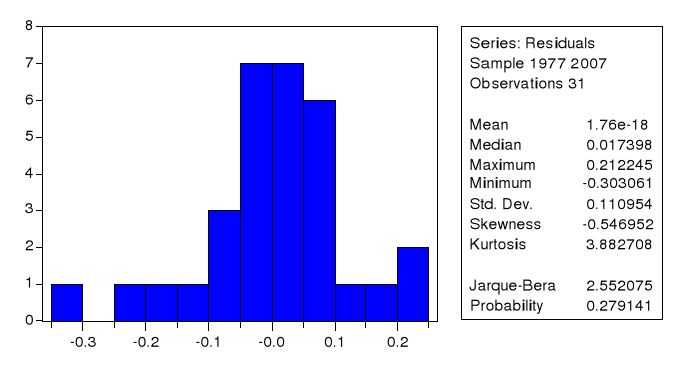
TEST DE STABILITE DU MODELE
· CUSUM
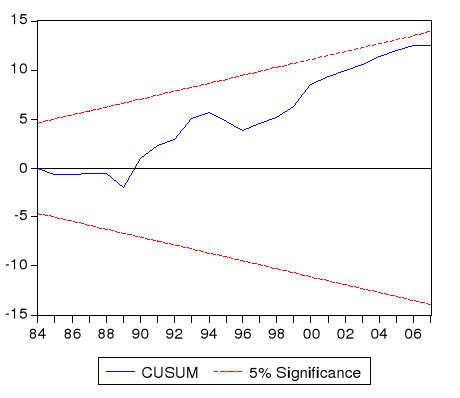
· CUSUM CARRE
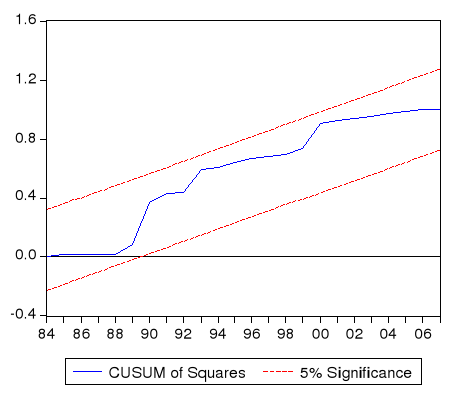
Figure 1TEST D'HOMOCEDASTICITE DE WHITE
|
White Heteroskedasticity Test:
|
|
|
|
|
|
|
|
|
|
|
|
|
F-statistic
|
2.865783
|
Probability
|
0.071465
|
|
Obs*R-squared
|
20.34899
|
Probability
|
0.060766
|
|
|
|
|
|
|
|
|
|
|
|
|
|
|
|
|
Test Equation:
|
|
|
|
Dependent Variable: RESID^2
|
|
|
|
Method: Least Squares
|
|
|
|
Date: 04/11/09 Time: 14:28
|
|
|
|
Sample: 1977 2007
|
|
|
|
Included observations: 31
|
|
|
|
|
|
|
|
|
|
|
|
|
|
Variable
|
Coefficient
|
Std. Error
|
t-Statistic
|
Prob.
|
|
|
|
|
|
|
|
|
|
|
|
C
|
0.021949
|
0.005792
|
3.789714
|
0.0013
|
|
D(LPIB)
|
-0.143179
|
0.091338
|
-1.567571
|
0.1344
|
|
(D(LPIB))^2
|
0.650054
|
0.673285
|
0.965496
|
0.3471
|
|
D(TINT)
|
0.012292
|
0.004385
|
2.802903
|
0.1118
|
|
(D(TINT))^2
|
0.001275
|
0.002712
|
0.470207
|
0.6439
|
|
D(LDET)
|
0.029953
|
0.018149
|
1.650415
|
0.1162
|
|
(D(LDET))^2
|
0.071908
|
0.040534
|
1.774037
|
0.0930
|
|
INFL
|
-0.371408
|
0.118698
|
-3.129023
|
0.1058
|
|
INFL^2
|
0.372903
|
0.336538
|
1.108056
|
0.2824
|
|
D(TCH)
|
0.000181
|
7.40E-05
|
2.445504
|
0.0750
|
|
(D(TCH))^2
|
-1.49E-07
|
3.88E-07
|
-0.382870
|
0.7063
|
|
RESS(-1)
|
-0.029447
|
0.016963
|
-1.735977
|
0.0997
|
|
RESS(-1)^2
|
0.008555
|
0.034682
|
0.246680
|
0.8079
|
|
|
|
|
|
|
|
|
|
|
|
R-squared
|
0.656419
|
Mean dependent var
|
0.011914
|
|
Adjusted R-squared
|
0.427365
|
S.D. dependent var
|
0.020562
|
|
S.E. of regression
|
0.015560
|
Akaike info criterion
|
-5.193144
|
|
Sum squared resid
|
0.004358
|
Schwarz criterion
|
-4.591795
|
|
Log likelihood
|
93.49373
|
F-statistic
|
2.865783
|
|
Durbin-Watson stat
|
2.145552
|
Prob(F-statistic)
|
0.221465
|
|
|
|
|
|
|
|
|
|
|
TEST D'AUTOCORRELATION DES ERREURS
|
Breusch-Godfrey Serial Correlation LM Test:
|
|
|
|
|
|
|
|
|
|
|
|
|
F-statistic
|
0.794209
|
Probability
|
0.464475
|
|
Obs*R-squared
|
2.087505
|
Probability
|
0.352131
|
|
|
|
|
|
|
|
|
|
|
|
|
|
|
|
|
Test Equation:
|
|
|
|
Dependent Variable: RESID
|
|
|
|
Method: Least Squares
|
|
|
|
Date: 04/11/09 Time: 14:30
|
|
|
|
Presample missing value lagged residuals set to zero.
|
|
|
|
|
|
|
|
|
|
|
|
Variable
|
Coefficient
|
Std. Error
|
t-Statistic
|
Prob.
|
|
|
|
|
|
|
|
|
|
|
|
C
|
0.009255
|
0.035031
|
0.264185
|
0.7941
|
|
D(LPIB)
|
-0.118892
|
0.523577
|
-0.227077
|
0.8225
|
|
D(TINT)
|
0.005341
|
0.028482
|
0.187541
|
0.8530
|
|
D(LDET)
|
0.044712
|
0.130866
|
0.341663
|
0.7358
|
|
INFL
|
-0.147014
|
0.441994
|
-0.332616
|
0.7426
|
|
D(TCH)
|
-3.32E-05
|
0.000414
|
-0.080226
|
0.9368
|
|
RESS(-1)
|
-0.031156
|
0.098846
|
-0.315202
|
0.7556
|
|
RESID(-1)
|
0.235252
|
0.222142
|
1.059015
|
0.3011
|
|
RESID(-2)
|
0.125918
|
0.240673
|
0.523189
|
0.6061
|
|
|
|
|
|
|
|
|
|
|
|
R-squared
|
0.067339
|
Mean dependent var
|
1.76E-18
|
|
Adjusted R-squared
|
-0.271811
|
S.D. dependent var
|
0.110954
|
|
S.E. of regression
|
0.125128
|
Akaike info criterion
|
-1.081255
|
|
Sum squared resid
|
0.344456
|
Schwarz criterion
|
-0.664936
|
|
Log likelihood
|
25.75946
|
F-statistic
|
0.198552
|
|
Durbin-Watson stat
|
2.054666
|
Prob(F-statistic)
|
0.988095
|
|
|
|
|
|
|
|
|
|
|
NB : les résultats des
estimations après introduction de retard ne sont pas concluants: les
modèles à correction d'erreur ne sont pas globalement
significatifs, aucune des variables n'est significative à court terme,
les R² sont faibles et les testes sur les résidus ne sont pas
concluants.
ESTIMATION DU MODELE1 DE LONG TERME APRES INTRODUCTION DE TSS
AVEC UN RETARD
|
Dependent Variable: IDH
|
|
|
|
Method: Least Squares
|
|
|
|
Date: 06/27/09 Time: 08:39
|
|
|
|
Sample (adjusted): 1977 2007
|
|
|
|
Included observations: 31 after adjustments
|
|
|
|
|
|
|
|
|
|
|
|
|
Variable
|
Coefficient
|
Std. Error
|
t-Statistic
|
Prob.
|
|
|
|
|
|
|
|
|
|
|
|
C
|
-0.307075
|
0.218094
|
-1.407996
|
0.1725
|
|
LPIB
|
0.072396
|
0.022901
|
3.161246
|
0.0044
|
|
LIT
|
0.034320
|
0.007404
|
4.635538
|
0.0001
|
|
LDET
|
-0.011700
|
0.008599
|
-1.360588
|
0.1868
|
|
LAID
|
0.015445
|
0.010974
|
1.407431
|
0.1727
|
|
TO
|
0.003778
|
0.030871
|
0.122373
|
0.9037
|
|
TSS (-1)
|
-0.001206
|
0.000894
|
-1.349690
|
0.1903
|
|
SDEXP
|
-4.87E-05
|
0.000240
|
-0.202690
|
0.8412
|
|
|
|
|
|
|
|
|
|
|
|
R-squared
|
0.910030
|
Mean dependent var
|
0.389960
|
|
Adjusted R-squared
|
0.882647
|
S.D. dependent var
|
0.039908
|
|
S.E. of regression
|
0.013671
|
Akaike info criterion
|
-5.529423
|
|
Sum squared resid
|
0.004299
|
Schwarz criterion
|
-5.159362
|
|
Log likelihood
|
93.70605
|
F-statistic
|
33.23424
|
|
Durbin-Watson stat
|
1.726228
|
Prob(F-statistic)
|
0.000000
|
|
|
|
|
|
|
|
|
|
|
ESTIMATION DU MODELE A CORRECTION D'ERREUR APRES INTRODUCTION DE
TSS AVEC UN RETARD
|
Dependent Variable: D(IDH)
|
|
|
|
Method: Least Squares
|
|
|
|
Date: 07/02/09 Time: 03:09
|
|
|
|
Sample (adjusted): 1979 2007
|
|
|
|
Included observations: 29 after adjustments
|
|
|
|
|
|
|
|
|
|
|
|
|
Variable
|
Coefficient
|
Std. Error
|
t-Statistic
|
Prob.
|
|
|
|
|
|
|
|
|
|
|
|
C
|
-0.000566
|
0.004610
|
-0.122679
|
0.9036
|
|
D(LPIBR)
|
0.107725
|
0.102167
|
1.054393
|
0.3043
|
|
D(LIT)
|
0.004021
|
0.017062
|
0.235696
|
0.8161
|
|
D(LDET)
|
-0.004754
|
0.013515
|
-0.351727
|
0.7287
|
|
D(LAID)
|
-0.001144
|
0.012778
|
-0.089496
|
0.9296
|
|
D(DO)
|
0.000332
|
0.000276
|
1.203115
|
0.2430
|
|
D(TSS(-1))
|
-0.000288
|
0.000804
|
-0.358528
|
0.7237
|
|
D(SDEXP)
|
0.000142
|
0.000188
|
0.756003
|
0.4585
|
|
SER01(-1)
|
-0.267582
|
0.229729
|
-1.164773
|
0.2578
|
|
|
|
|
|
|
|
|
|
|
|
R-squared
|
0.258676
|
Mean dependent var
|
0.003267
|
|
Adjusted R-squared
|
-0.037854
|
S.D. dependent var
|
0.013470
|
|
S.E. of regression
|
0.013722
|
Akaike info criterion
|
-5.490478
|
|
Sum squared resid
|
0.003766
|
Schwarz criterion
|
-5.066145
|
|
Log likelihood
|
88.61193
|
F-statistic
|
0.872344
|
|
Durbin-Watson stat
|
2.154590
|
Prob(F-statistic)
|
0.555165
|
|
|
|
|
|
|
|
|
|
|
ESTIMATION DU MODELE2 DE LONG TERME APRES INTRODUCTION DE LPIB ET
LDET AVEC UN RETARD
|
Dependent Variable: LIT
|
|
|
|
Method: Least Squares
|
|
|
|
Date: 07/02/09 Time: 03:33
|
|
|
|
Sample (adjusted): 1977 2007
|
|
|
|
Included observations: 31 after adjustments
|
|
|
|
|
|
|
|
|
|
|
|
|
Variable
|
Coefficient
|
Std. Error
|
t-Statistic
|
Prob.
|
|
|
|
|
|
|
|
|
|
|
|
C
|
10.92056
|
3.245915
|
3.364400
|
0.0025
|
|
LPIB(-1)
|
2.619658
|
0.389072
|
6.733101
|
0.0000
|
|
LDET(-1)
|
-0.851561
|
0.218412
|
-3.898868
|
0.0006
|
|
TINT
|
-0.093495
|
0.064043
|
-1.459868
|
0.1568
|
|
INFL
|
2.628537
|
0.812085
|
3.236778
|
0.0034
|
|
TCH
|
0.003248
|
0.000786
|
4.132648
|
0.0004
|
|
|
|
|
|
|
|
|
|
|
|
R-squared
|
0.868264
|
Mean dependent var
|
5.105758
|
|
Adjusted R-squared
|
0.841916
|
S.D. dependent var
|
0.677321
|
|
S.E. of regression
|
0.269301
|
Akaike info criterion
|
0.386012
|
|
Sum squared resid
|
1.813076
|
Schwarz criterion
|
0.663558
|
|
Log likelihood
|
0.016819
|
F-statistic
|
32.95460
|
|
Durbin-Watson stat
|
1.013195
|
Prob(F-statistic)
|
0.000000
|
|
|
|
|
|
|
|
|
|
|
ESTIMATION DU MODELE2 A CORRECTION D'ERREUR APRES INTRODUCTION
DE LPIB ET LDET AVEC UN RETARD
|
Dependent Variable: D(LIT)
|
|
|
|
Method: Least Squares
|
|
|
|
Date: 07/02/09 Time: 03:37
|
|
|
|
Sample (adjusted): 1979 2007
|
|
|
|
Included observations: 29 after adjustments
|
|
|
|
|
|
|
|
|
|
|
|
|
Variable
|
Coefficient
|
Std. Error
|
t-Statistic
|
Prob.
|
|
|
|
|
|
|
|
|
|
|
|
C
|
0.034385
|
0.037689
|
0.912336
|
0.3715
|
|
D(LPIB(-1))
|
0.531317
|
0.553921
|
0.959193
|
0.3479
|
|
D(LDET(-1))
|
-0.010869
|
0.183189
|
-0.059335
|
0.9532
|
|
D(TINT)
|
-0.060342
|
0.048732
|
-1.238261
|
0.2287
|
|
D(INFL)
|
1.186524
|
0.422130
|
2.810801
|
0.0102
|
|
D(TCH)
|
0.000481
|
0.000612
|
0.785906
|
0.4403
|
|
SER02(-1)
|
0.356668
|
0.199238
|
1.790164
|
0.0872
|
|
|
|
|
|
|
|
|
|
|
|
R-squared
|
0.348210
|
Mean dependent var
|
0.055492
|
|
Adjusted R-squared
|
0.170449
|
S.D. dependent var
|
0.178506
|
|
S.E. of regression
|
0.162583
|
Akaike info criterion
|
-0.588751
|
|
Sum squared resid
|
0.581531
|
Schwarz criterion
|
-0.258714
|
|
Log likelihood
|
15.53689
|
F-statistic
|
1.958868
|
|
Durbin-Watson stat
|
2.064989
|
Prob(F-statistic)
|
0.115746
|
|
|
|
|
|
|
|
|
|
|
TABLE DES
MATIERES
AVERTISSEMENT
a
GLOSSAIRE DES SIGLES ET ABREVIATIONS
e
LISTE DES TABLEAUX ET GRAPHIQUES
f
SOMMAIRE
7
INTRODUCTION
1
CHAPITRE I : CADRE THEORIQUE ET
METHODOLOGIE DE LA RECHERCHE
3
1-1 PROBLEMATIQUE, OBJECTIFS ET HYPOTHESES DE
L'ETUDE
3
1-1- 1 Problématique
3
1-1-2 Objectifs et Hypothèse de
l'étude
7
1-1-3 Intérêt du sujet
7
1-2 REVUE DE LA LITTÉRATURE
7
1-2-1 Définition des concepts
8
1-2-2 Cadre théorique
12
1-2-3 Études empiriques
20
1-3 MÉTHODOLOGIE DE RECHERCHE
23
1-3-1 Méthode d'analyse
23
1-3-2 Spécification des modèles
23
1-3-3 Procédure d'estimation
24
1-3-4 Choix des variables et sources des
données
27
CHAPITRE II: ETUDE DE LA DETTE EXTERIEURE DU
BÉNIN
30
2-1 LES ORIGINES DE LA CRISE DE LA DETTE DES
PED
30
2-2 INITIATIVES POUR RESORBER LE SURENDETTEMENT DE
PAYS EN DEVELOPPEMENT
32
2-3 CARACTERISTIQUES DE L'ECONOMIE BENINOISE
33
2-4 ORIGINE ET ETAPES DE L'ENDETTEMENT EXTERIEUR
DU BENIN
35
2-5 INITIATIVE PPTE ET ELIGIBILITE DU BENIN
37
2-6 AUTRES INITIATIVES LIEES A L'IPPTE
38
2-7 ÉVOLUTION DE LA DETTE EXTERIEURE DU
BENIN
39
2-7-1 Évolution de l'encours de la dette
extérieure
39
2-7-2 Évolution du service de la dette
41
2-7-4 Évolution des ratios de la dette
41
CHAPITRE III : ANAYSE ECONOMETRIQUE
44
3-1 ESTIMATION DU MODELE 1
44
3-1-1 Rappel du modèle
44
3-1-2 Présentation des résultats
45
3-1-2 Interpretation des résultats
48
3-2 ESTIMATION DU MODELE 2
49
3-2-1 Rappel du modèle
50
3-2-2 Présentation des résultats
50
3-2-3 Interprétation des
résultats .52
3-4 RECOMMANDATIONS
54
CONCLUSION
56
REFERENCES BIBLIOGRAPHIQUES
58
ANNEXE
i
TABLE DES MATIERES
ii
      
| 
